


thrive at work/Employee Net Promoter Score
Explainer · eNPS
The employee Net Promoter Score.
eNPS asks one question: how likely are you to recommend this organization as a place to work? It is quick and comparable, and it tells you very little about why.
By Jerry Fiser, Founder & CEO · Reviewed by Marcin Bulik, Research Director · Updated November 8, 2026
Free download
eNPS calculator
Paste 0–10 scores and get promoters, passives, detractors and eNPS.
Download (Excel)How do you calculate eNPS?
Ask employees how likely they are to recommend the organization as a place to work on a scale of 0 to 10. Promoters answer 9 or 10, passives 7 or 8, detractors 0 to 6. eNPS is the percentage of promoters minus the percentage of detractors, giving a score between -100 and +100.
- eNPS asks one question: how likely are you to recommend us as a place to work?
- Score = % promoters (9 to 10) minus % detractors (0 to 6).
- It tells you how people feel, not why.
- Pair it with driver questions to know what to change.
The employee Net Promoter Score formula.
| Group | Score | Counts as |
|---|---|---|
| Promoters | 9 to 10 | Added |
| Passives | 7 to 8 | Ignored |
| Detractors | 0 to 6 | Subtracted |
eNPS = % promoters minus % detractors. The result runs from minus 100 to plus 100.
The Net Promoter Score method was created at Bain & Company; see the Net Promoter System site from Bain & Company. The CIPD factsheet on employee engagement explains why a single item should sit next to broader engagement measures.
A note on eNPS calculation.
Passives count in the total but not in the subtraction, so they pull the score toward zero.
How to calculate eNPS step by step.
- 1Ask the question. "How likely are you to recommend this organization as a place to work?" on a 0 to 10 scale.
- 2Group the answers. Promoters 9 to 10, passives 7 to 8, detractors 0 to 6.
- 3Calculate the shares. Divide each group by the total number of answers.
- 4Subtract. eNPS = percentage of promoters minus percentage of detractors.
- 5Report as a whole number. The result ranges from −100 to +100.
Employee Net Promoter Score: a worked example.
100 employees answer. 40 give 9 or 10, 35 give 7 or 8, 25 give 0 to 6. Promoters are 40%, detractors 25%. eNPS = 40 - 25 = +15.
Reading employee Net Promoter Score by group.
An overall score hides differences. Break eNPS down by team, location, tenure and role, as long as each group has at least five answers. A strong company score can hide a team with many detractors, and new hires often score differently from long-tenured staff. The differences show where to act first.
What is a good employee Net Promoter Score?
Any positive score means more promoters than detractors. Your own trend over time and the spread between teams are more useful than comparing against other companies, because culture, country and survey method all affect the number.

How to read an employee Net Promoter Score.
| Score | How to read it | What to do |
|---|---|---|
| Below 0 | More detractors than promoters | Read the reasons closely; act on the most common theme |
| 0 to 20 | A mixed picture | Look for teams with very different scores |
| 20 to 50 | More promoters than detractors | Protect what works; watch for falling trends |
| Above 50 | Strong advocacy | Check that capacity holds, so the score lasts |
These ranges are rough guides, not benchmarks. Scores vary with industry, country and survey timing, so your own trend over time is the most reliable comparison.
How to run an employee Net Promoter Score survey.
- 1Ask the standard question. "On a scale from 0 to 10, how likely are you to recommend this organization as a place to work?"
- 2Add a follow-up. "What is the main reason for your score?"
- 3Keep it anonymous. Report only for groups of five or more.
- 4Run it regularly. Quarterly or twice a year, at the same point in the cycle.
- 5Share and act. Show the score and the top reasons, then agree actions.
How often to measure employee Net Promoter Score.
Quarterly works for most organizations: often enough to see trends, rare enough that teams can act between surveys. Ask the question at the same time each quarter and in the same wording, because both timing and wording affect scores. Add it to a pulse survey rather than sending it alone, so that the score comes with the drivers that explain it.
Follow-up questions for an employee Net Promoter Score survey.
Follow-up questions
- What is the main reason for your score?
- What is one thing that would raise your score?
- How supported do you feel by your manager?
- How manageable is your workload right now?
- Do you see a future for yourself here?
- How well do you understand our direction?
Employee Net Promoter Score follow-up questions by theme.
| Theme | Follow-up question |
|---|---|
| Main reason | What is the main reason for your score? |
| Improvement | What one change would make you more likely to recommend us? |
| Manager | How well does your manager support you? |
| Workload | Is your workload manageable over the long term? |
| Growth | Can you see a next step for your career here? |
| Energy | Do you usually have energy left at the end of the working day? |
Reading the reasons behind an employee Net Promoter Score.
The follow-up question is where eNPS becomes useful. Group open answers into themes such as manager, workload, growth, pay and culture, and count how often each appears among promoters and detractors. A theme that appears mostly among detractors is the place to act first.
Share the themes with teams, not just the score. "Workload came up in a third of detractor comments" gives a team something concrete to discuss, while "our eNPS fell by five points" rarely does.
Using the employee Net Promoter Score well.
Ask the eNPS question in the same way at the same intervals, and always with a follow-up such as "What is the main reason for your score?". The reasons are where the value is. Group open answers into themes and share the top three with teams.
Do not set eNPS targets for managers. Targets invite pressure on people to answer higher and make the number meaningless. Treat eNPS as a headline and use driver questions on the manager, growth, workload, recognition and energy to understand what to change.
Keeping employee Net Promoter Score surveys anonymous.
Report eNPS only for groups of five or more and avoid filters that create smaller groups. Read open comments without names and remove details that could identify the writer. People give honest scores only when they trust that their answer cannot be traced back to them.
How to raise an employee Net Promoter Score.
Work on the drivers behind the score rather than the score itself: manager support, growth, recognition, fair pay and a sustainable workload. Read the follow-up comments by theme, pick the two most common issues among detractors and act on them visibly. Never set eNPS targets for managers; that invites pressure on people to answer higher.
Employee Net Promoter Score actions by group.
| Group | What they need | Actions |
|---|---|---|
| Detractors | Their main frustration addressed | Read reasons by theme; fix the most common one; report back |
| Passives | A reason to become advocates | Visible growth, recognition, clearer direction |
| Promoters | Their goodwill protected | Avoid overloading them; recognize their contribution |
Promoters are often the people others rely on most. If their workload keeps rising, they can move from promoters to leavers without passing through a low score.
The value of eNPS, and where it falls short.
eNPS is quick, easy to explain and comparable over time, which makes it a useful headline. Its weaknesses are just as clear: one question cannot tell you why people feel the way they do, the score jumps around in small groups, and it says nothing about whether people have the energy to keep going. Use it as a signal and pair it with driver and capacity measures.
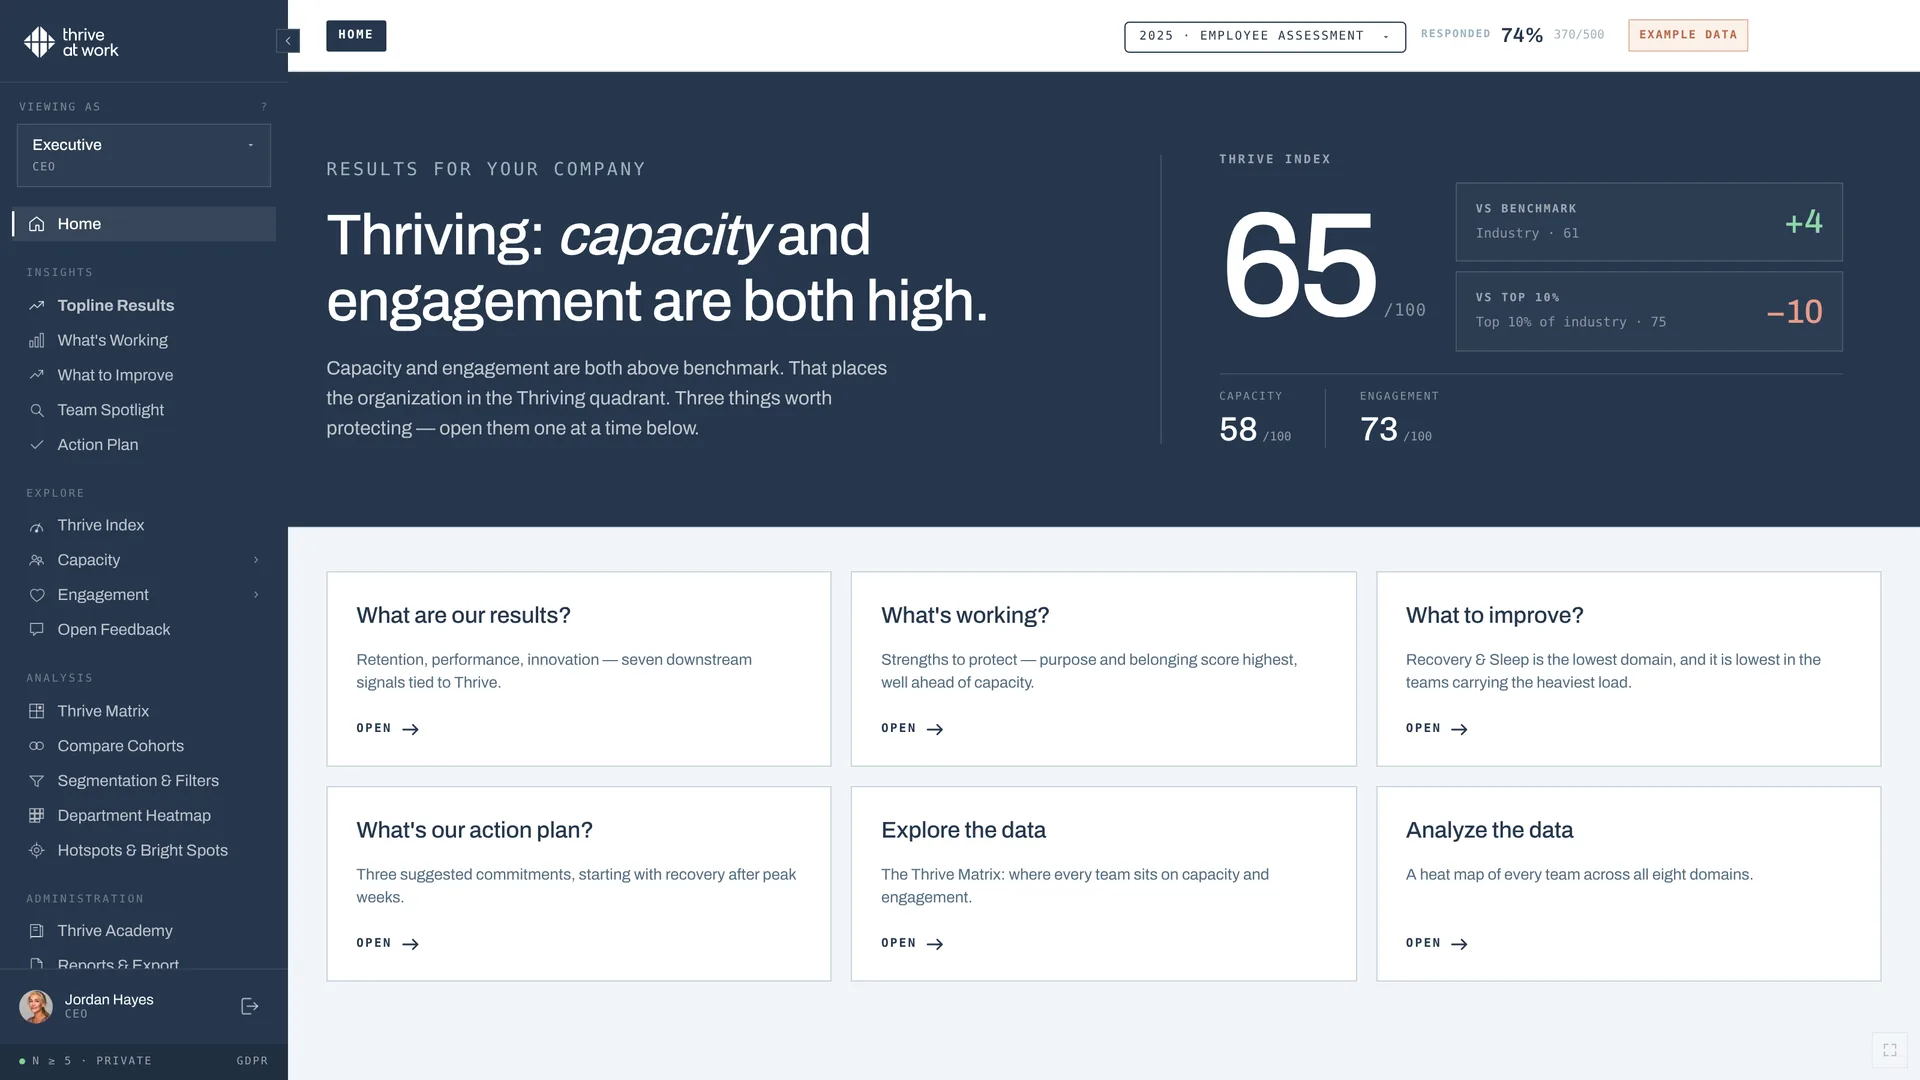
eNPS tells you whether people would recommend you, not why, and not whether they can keep going. Pair it with questions on the drivers of engagement and on capacity: energy, recovery, focus and resilience.
Employee Net Promoter Score compared with an engagement survey.
| eNPS | Engagement survey | |
|---|---|---|
| Questions | One, plus a follow-up | 30 to 60 statements |
| Shows | Overall advocacy | Drivers of commitment and where to act |
| Strength | Quick, easy to track | Explains why scores change |
| Limit | Cannot say what to fix | Takes longer to run and analyze |
Use eNPS as a headline and an engagement survey, ideally with capacity measures, to understand what lies behind it.
thrive at work measures engagement (purpose, leadership, connection, growth) and capacity (energy, recovery, focus, resilience) in one anonymous survey: the employee engagement survey.
Good eNPS work needs a survey people trust and results managers can act on. In Employee Experience Management (EXM) terms, thrive at work is an employee engagement platform that measures engagement and capacity to perform in one anonymous survey. See the employee survey platform or read more about employee engagement.
Sources.
- Net Promoter System site from Bain & Company. www.netpromotersystem.com
- CIPD factsheet on employee engagement. www.cipd.org
Common questions
What is a good eNPS score?
How often should eNPS be measured?
How do you calculate eNPS?
Is eNPS a good measure of engagement?
What is the eNPS question?
Can eNPS be negative?
When should you measure eNPS?

Go beyond one question. See why.
A 30-minute call covers what a full measurement adds to eNPS.