


thrive at work/Cost of employee turnover
Calculator · Turnover cost
The cost of employee turnover.
Every resignation has a price: finding someone new, training them, and months of lower output while they get up to speed. Most of it never shows up on one invoice.
By Jerry Fiser, Founder & CEO · Reviewed by Marcin Bulik, Research Director · Updated November 8, 2026
Free download
Employee turnover cost calculator
Exit, vacancy, recruiting, onboarding and ramp-up costs per leaver and per year.
Download (Excel)How do you calculate the cost of employee turnover?
Add the direct costs of replacing someone (advertising, agency fees, interview time, onboarding and training) to the lost productivity while the role is empty and while the new hire ramps up. Multiply the cost per leaver by the number of leavers per year.
- Turnover costs include hiring, onboarding, lost productivity and the load on colleagues.
- The biggest costs are hidden: the months before leaving and the ramp-up after.
- Senior and specialist roles cost more to replace.
- Prevention is cheaper than replacement.
What goes into the cost of employee turnover.
The CIPD factsheet on employee turnover and retention lists the cost elements organizations usually include, and the SHRM toolkit on managing employee retention offers tools for estimating them.
- 1Separation. Exit admin, final pay processing, knowledge handover.
- 2Vacancy. Work not done or covered by overtime while the role is empty.
- 3Recruiting. Ads, agency fees, interview hours, assessments.
- 4Onboarding. Training time, equipment, the manager's and colleagues' time.
- 5Ramp-up. Lower productivity for months until the new person is fully effective.
- 6Hidden. Lost client relationships, lower team morale, more resignations.
Cost of employee turnover: a worked example.
The example below uses illustrative figures for one role. Replace them with your own.
| Cost item | Calculation | Amount |
|---|---|---|
| Recruiting | Job ads, agency fee and interview time | €6,000 |
| Onboarding and training | Training time, equipment, colleagues’ time | €4,000 |
| Vacancy | Two months without the role; half covered by overtime at €2,500 a month | €2,500 |
| Ramp-up | Annual salary €60,000 ÷ 12 × 6 months × 50% lower productivity | €15,000 |
| Total per leaver | Sum of the above | €27,500 |
| Ten leavers a year | €27,500 × 10 | €275,000 |
The ramp-up line is often the largest. It is also the one most organizations leave out, which is why turnover looks cheaper on paper than it is.
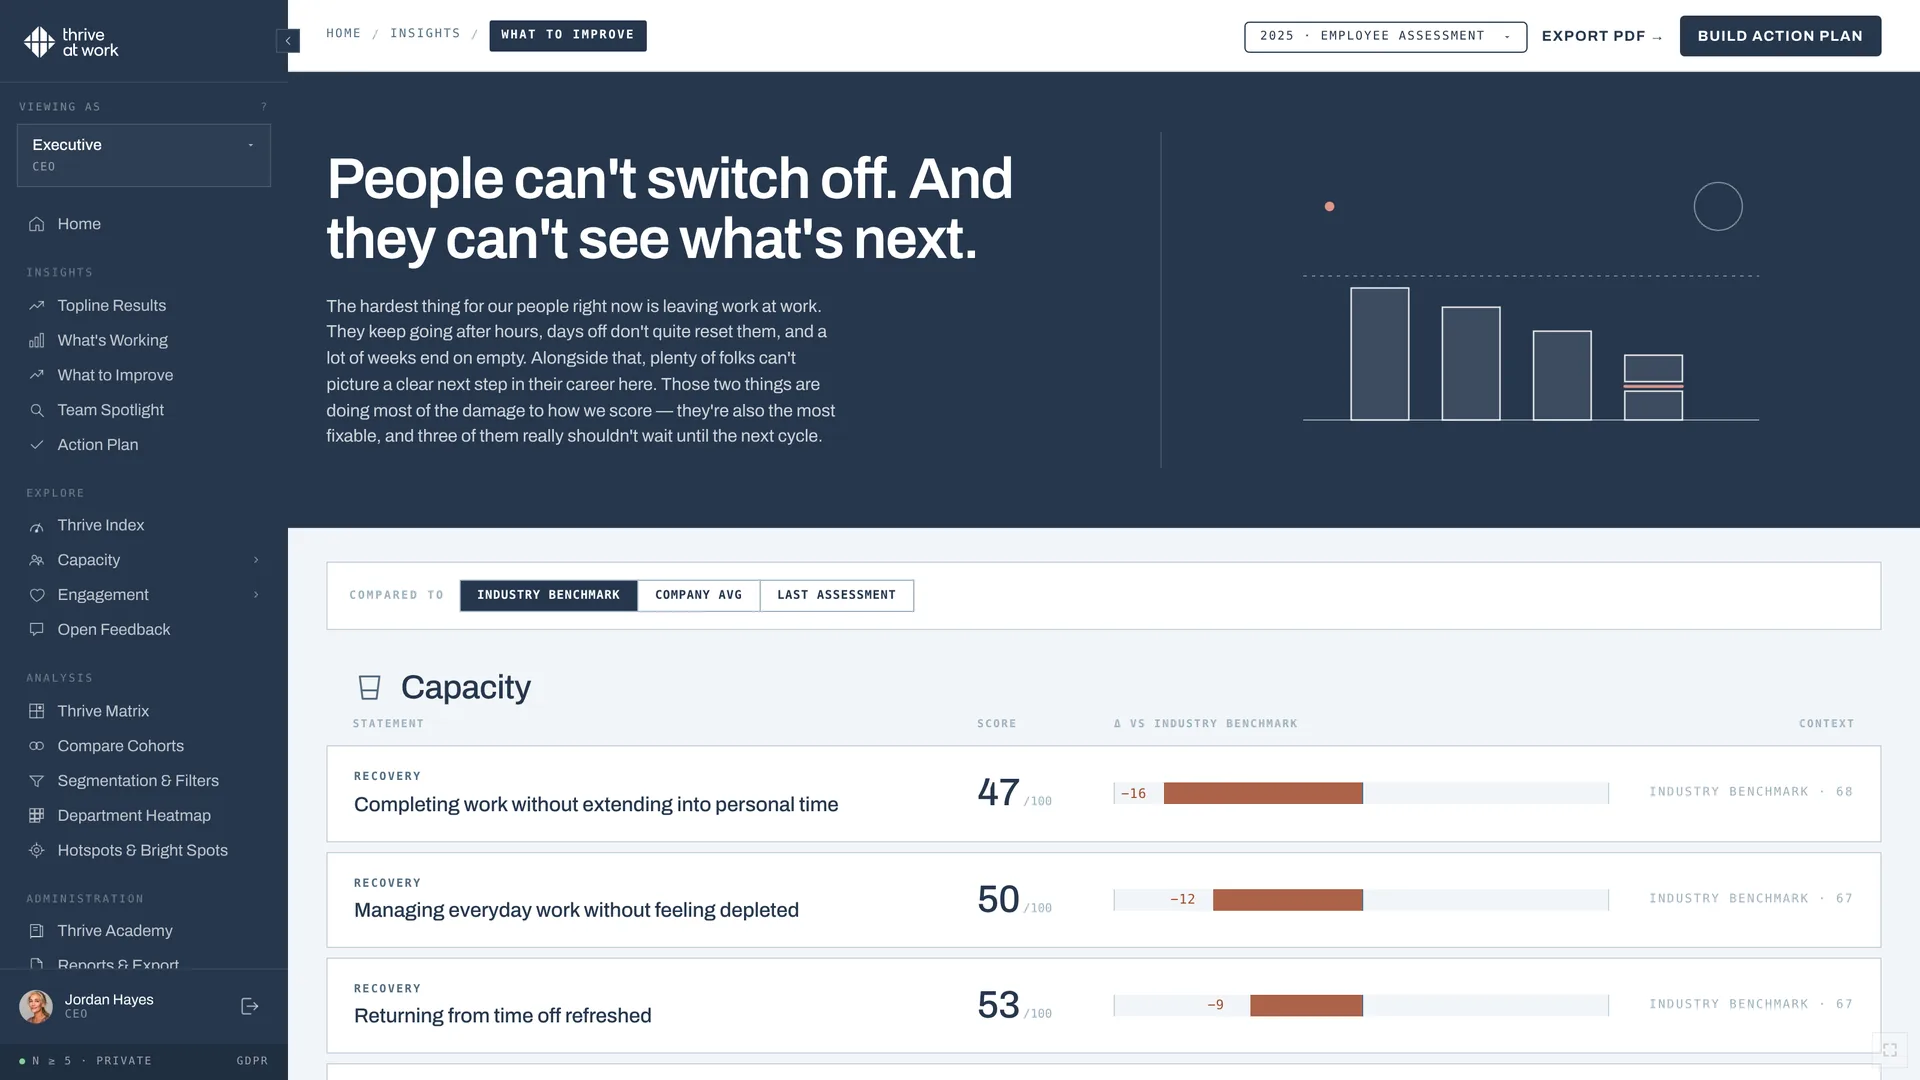
The cost to the team left behind.
When someone leaves, colleagues absorb the work, train the replacement and lose a trusted collaborator. If that extra load lasts for months, it raises the risk that the next person leaves too.
How turnover cost varies by role.
| Role type | What drives the cost |
|---|---|
| Entry-level, high-volume | Recruiting volume and training time; costs add up through frequency |
| Skilled specialist | Long vacancies and slow ramp-up; scarce candidates |
| Customer-facing | Lost relationships and revenue at risk |
| Manager | Team disruption and further resignations in the team |
| Senior leader | Search fees, long vacancies, strategic delay |
Because costs vary so much by role, calculate separately for your main role types rather than using one company-wide figure.
Not every leaver costs the same.
A single turnover cost per head hides big differences. Split leavers into groups before you add up the cost, because each group calls for a different response.
| Group | What it means | Cost signal |
|---|---|---|
| Voluntary | The employee chooses to leave | Usually the most expensive group to replace, and the one prevention can reach |
| Involuntary | The employer ends the employment | Points to hiring, onboarding or performance management problems |
| Regretted | People you wanted to keep | The number leaders should watch most closely |
| Non-regretted | People whose departure the team can absorb or even benefits from | Still costs recruiting and ramp-up time, but less disruption |
| Early leavers | People who go within their first year | Hiring and onboarding spend is lost before it pays back |
Two costs are easy to miss. Knowledge walks out with experienced people, especially informal knowledge about clients, systems and workarounds that was never written down. And a team that runs short-staffed while a role is open carries extra load for months, which raises the risk of the next resignation in the same team.
Cost of employee turnover calculator.
Estimated yearly cost of turnover:
Lost productivity = salary / 12 x ramp-up months x (1 - productivity during ramp-up). Vacancy time, overtime and lost knowledge are not included.
Where to find the inputs for the turnover cost calculator.
Recruiting costs come from finance and recruiting records: job ad spend, agency fees and the hours spent interviewing. Onboarding costs come from training records and estimates of colleagues’ time. Salaries come from payroll. Ramp-up time and productivity during ramp-up are best estimated with managers for each role type, because they differ widely between roles. Write down your assumptions so the figure can be updated when they change.
Why industry averages are not a budget number.
Published estimates of turnover cost vary widely, often expressed as a share of annual salary, because they use different inputs and assumptions. They are useful to show that turnover is expensive, but your own number depends on the role, the labor market, how long the vacancy lasts and how long a new hire takes to reach full productivity. Build your own estimate with the calculator above, using your hiring costs and realistic ramp-up times.
The cost of prevention compared with the cost of turnover.
Turnover cost becomes useful when it is compared with the cost of preventing it. If a team loses several people a year to overload, the cost of hiring one extra person to share the load may be lower than the cost of replacing those who leave. If first-year turnover is high, a better onboarding program may pay for itself with a few avoided resignations.
Present both figures together to leaders: what turnover costs this year, and what the proposed change costs. That turns retention from a soft topic into a budget decision.
Common reasons employees leave, and what each costs.
| Reason | Why it is expensive |
|---|---|
| Poor manager relationship | Often affects several people in the same team |
| No visible growth | Tends to hit ambitious, high-potential people |
| Pay that feels unfair | Leads to losses in hard-to-fill roles |
| Unsustainable workload | Exhausted people work at reduced capacity before they leave |
| Bad onboarding | You pay hiring costs and lose the person within months |
Knowing why people leave tells you which costs to expect and which prevention will pay back fastest.
Early warning signs that turnover cost is about to rise.
- 1Falling energy and recovery in a team. Capacity usually drops before resignations.
- 2Rising overtime. Workload is outpacing the team.
- 3More short absences. Often an early sign of strain.
- 4Lower intention to stay in surveys. People are starting to look elsewhere.
- 5A respected manager leaving. Teams often follow within months.
- 6Fewer internal moves. Growth paths may be blocked.
Building the business case.
To make the case for prevention, calculate the cost of turnover for one year using the calculator above, then compare it with the cost of the changes that would prevent some of it, such as manager training, better onboarding or workload planning. Even a small reduction in avoidable turnover usually pays for these.
Present the numbers by team and role. Leaders respond to the specific: "We replaced eight specialists in this team last year" is more persuasive than a company-wide percentage. Add what you know about the months before people left, when reduced capacity and extra load on colleagues were already costing money.
How to present the cost of employee turnover to leaders.
Lead with one number: the yearly cost of turnover in the roles that matter most. Show how it was calculated, with your own salaries, hiring costs and ramp-up times. Then show the cause, such as first-year leavers or overload in one team, and the cost of the proposed fix. A comparison of two figures, cost of turnover and cost of prevention, makes a decision easy to take.
Seven ways to reduce the cost of employee turnover.
The cheapest resignation is the one that does not happen. See retention strategies, and the related cost of burnout calculator.
- 1Find where turnover concentrates. Split by team, role and tenure.
- 2Fix onboarding. Early leavers are the most expensive per month of service.
- 3Develop managers. Manager quality explains much of the difference between teams.
- 4Make growth visible. Internal moves keep knowledge in the organization.
- 5Review workload. Sustainable pace protects the people you most want to keep.
- 6Hold stay interviews. Ask why people stay while you can still act.
- 7Measure early signals. Energy, recovery and intention to stay move before resignations.

Quick ways to lower the cost of each leaver.
Even when turnover cannot be avoided, its cost can be reduced. Document key knowledge before people leave, keep a pipeline of internal candidates for critical roles, shorten ramp-up with structured onboarding and buddies, and stay in touch with good leavers, some of whom return.
thrive at work measures engagement (purpose, leadership, connection, growth) and capacity (energy, recovery, focus, resilience) in one anonymous survey: the employee engagement survey.
Turnover cost numbers only show who has already gone. thrive at work is a workforce performance platform: an employee engagement platform that reads engagement next to capacity to perform, so you can spot the teams at risk months earlier. Read more about employee engagement.
Sources.
- CIPD factsheet on employee turnover and retention. www.cipd.org
- SHRM toolkit on managing employee retention. www.shrm.org
- thrive index validation study. thrive at work, 2025–26. Methodology.
Common questions
What is the biggest cost of employee turnover?
Are senior roles more expensive to replace?
How do you calculate the cost of employee turnover?
How can companies reduce turnover costs?
Why is employee turnover so expensive?
How do you calculate the cost of losing an employee?

Cut turnover cost at the source.
A 30-minute call covers where resignation risk sits in your teams.