

thrive at work/Workforce performance software
Buyer guide · Software
Workforce performance management software: measure what drives output.
Most performance software tracks goals and reviews. Workforce performance depends on more than that: whether people are engaged, and whether they have the capacity to keep delivering.
By Jerry Fiser, Founder & CEO · Reviewed by Marcin Bulik, Research Director · Updated November 8, 2026
What is workforce performance management software?
Workforce performance management software helps organizations understand and improve how well teams perform. Traditional tools focus on goals, reviews and individual ratings. A workforce performance platform looks at the conditions behind performance: engagement, and capacity, meaning the energy, recovery, focus and resilience people need to sustain it, measured by team.
- Performance management tools track goals, reviews and ratings.
- Workforce performance depends on engagement and capacity as well.
- Capacity predicts delivery: thrive research found 56% vs 86% of priority work on time.
- Team-level measures support better decisions than individual ratings alone.
- thrive at work is a workforce performance platform.
Two kinds of performance software.
| Performance management tools | Workforce performance platforms | |
|---|---|---|
| Focus | Individual goals, reviews and ratings | Conditions for team performance |
| Main data | Manager ratings, goal progress | Engagement and capacity, by team |
| Typical question | How did this person do? | Can this team keep delivering? |
| Time frame | Looking back | Looking ahead |
Many organizations need both. They answer different questions.
What workforce performance means.
Workforce performance is the ability of an organization's people, taken together, to deliver what the organization needs, now and over time. It is different from adding up individual ratings. A team of strong individuals can underperform if priorities are unclear, tools get in the way or workload has outrun capacity. And a team can hit this quarter's numbers by burning through energy it will need next quarter. Workforce performance software looks at these team-level conditions.
Why traditional performance management falls short.
Annual reviews and ratings look back at what individuals did. They say little about whether a team can keep delivering, and they often arrive too late to change anything. Ratings also mix ability with conditions: a strong person in an overloaded team may look average. Many organizations have moved toward more frequent check-ins and goals. The missing piece is still the team-level view of the conditions that make performance possible.
Capacity vs productivity tracking.
Some tools sold for workforce performance track activity: keystrokes, active time, applications used, websites visited. That is monitoring, not performance measurement. It tells you whether people are busy, not whether they produce good work or can keep doing it, and it damages trust. In Europe it also raises serious legal questions under data protection rules and, in Germany, under works council co-determination. Measuring capacity is different: people report anonymously on their energy, recovery, focus and resilience, results are shown by team, and nobody is watched. The aim is to change how work is organized, not to police individuals.
What drives workforce performance.
- 1Clarity. People know what matters most.
- 2Engagement. People care about the work and trust their leaders.
- 3Capacity. People have the energy, recovery, focus and resilience to deliver.
- 4Enablement. Tools, processes and decisions help rather than block.
- 5Management. Managers coach, remove obstacles and protect workload.
Leading and lagging indicators.
| Lagging indicators | Leading indicators |
|---|---|
| Revenue per employee | Capacity: energy, recovery, focus, resilience |
| Missed deadlines | Engagement: purpose, leadership, connection, growth |
| Voluntary turnover | Workload and overtime trends |
| Absence days | Clarity of priorities |
| Quality incidents | Manager support and one-to-one frequency |
Lagging indicators tell you what already happened. Leading indicators give you time to act. Most performance software tracks the first group; workforce performance platforms focus on the second.
Why capacity predicts performance.
Output depends on whether people can sustain effort, not only whether they want to. thrive research found that people with the least capacity delivered 56% of priority work on time, against 86% for those with the most. Capacity is also where trouble shows first: falling energy and recovery usually come before missed deadlines, sick leave and resignations. Read more about employee capacity.
Energy, recovery, focus and resilience.
Capacity has four parts. Energy is the physical and mental fuel people bring to work. Recovery is whether they can switch off and recharge between working days. Focus is whether they can concentrate on the work that matters most, without constant interruptions. Resilience is whether they can handle pressure and setbacks without lasting harm. Each part can fall for different reasons, and each needs a different fix: workload for energy, boundaries for recovery, fewer meetings and messages for focus, and support for resilience. Measuring them separately tells leaders where to act.
Workforce performance metrics.
A practical scorecard combines a few outcome measures with a few leading indicators. Outcomes might include priority work delivered on time, customer satisfaction, quality incidents, voluntary turnover and absence. Leading indicators include the capacity index, the engagement index, workload and overtime trends, and the share of teams in each quadrant of the thrive matrix. Review the scorecard monthly at team level and quarterly at leadership level. When outcomes fall, look at which leading indicators moved first; over time that tells you which signals to trust in your organization.
Reporting workforce performance to leadership.
Leadership teams need a simple view: how many teams are thriving, coasting, burning out or depleted, how that has changed since last quarter, and which teams need a decision now. Keep the report to one page. Show the thrive matrix with team counts in each quadrant, the trend in average capacity and engagement, the three teams with the biggest decline and what is being done about each. Add the outcome measures the leadership team already tracks, such as turnover and delivery, so the link between conditions and results stays visible.
Sustainable performance.
Sustainable performance means delivering steadily without running people down. It looks unremarkable from week to week: planned workload, protected focus time, real breaks and leave, quick action when energy falls. Over a year, teams that work this way usually deliver more than teams that sprint and crash, because they lose fewer people, fewer days and less knowledge. For CEOs and boards, sustainable workforce performance is the outcome; capacity is how you see whether you are on track.
What boards should ask.
- 1Which teams are thriving, and which are depleted?. A simple view across the organization.
- 2Is capacity rising or falling?. Trend over the last year.
- 3Where do our growth plans depend on depleted teams?. Risk to delivery.
- 4What is leadership doing about it?. Named actions and owners.
- 5How do capacity trends relate to turnover and absence?. Evidence that the measure matters.

Risks to avoid.
Three risks come up often. The first is turning team data into individual judgment, which destroys trust and makes people answer less honestly. The second is measuring without acting, which teaches people that surveys do not matter. The third is treating capacity as an individual resilience problem and responding with workshops, when the cause is workload or poor work design. Keep data at team level, act visibly on a few priorities, and look at how work is organized before asking people to cope better.
The business case for workforce performance software.
The case rests on three costs that most organizations already carry: turnover, absence and lost delivery. Capacity data helps reduce all three by showing strain early enough to act. A practical way to estimate value is to take one cost, such as regretted turnover in critical roles, estimate what each leaver costs, and ask how many departures earlier action could prevent. Even a small number usually covers the cost of measurement. The less visible benefit is better planning: leaders stop committing teams to work they do not have the capacity to deliver.
Questions managers ask about capacity data.
Is this about my team's effort? No. Capacity reflects the conditions people work in, such as workload, recovery time and interruptions, more than individual effort. Will people be judged on their scores? No. Results are anonymous and reported by team. What if my team is in the Burning out quadrant? It means people are committed but running low; the first step is to reduce load and protect recovery, not to push harder. What if we are Coasting? People have energy but less connection to the work; focus on purpose, growth and recognition.
How quickly can scores change? Capacity can move within a few weeks when workload changes; engagement usually takes longer. Managers who act on one or two clear priorities and check at the next pulse tend to see the clearest progress.
Features to look for in workforce performance software.
- 01Team-level measures. Engagement and capacity by team, not just individual ratings.
- 02Leading indicators. Signals that warn before output falls.
- 03Clear categories. A simple way to see which teams are thriving, coasting, burning out or depleted.
- 04Action plans. Priorities routed to managers, the organization or individuals.
- 05Learning support. Short courses matched to each person's weakest area.
- 06Links to outcomes. Read alongside turnover, absence and delivery.
Responding to each thrive matrix quadrant.
| Quadrant | What it means | First response |
|---|---|---|
| Thriving | High engagement, high capacity | Protect it; learn what this team does well |
| Burning out | High engagement, low capacity | Reduce workload and protect recovery before adding anything |
| Coasting | Low engagement, high capacity | Reconnect people with purpose, growth and recognition |
| Depleted | Low engagement, low capacity | Relieve workload first, then rebuild trust and direction |
The same score on one index means different things depending on the other. That is why reading them together changes decisions.
The thrive matrix.
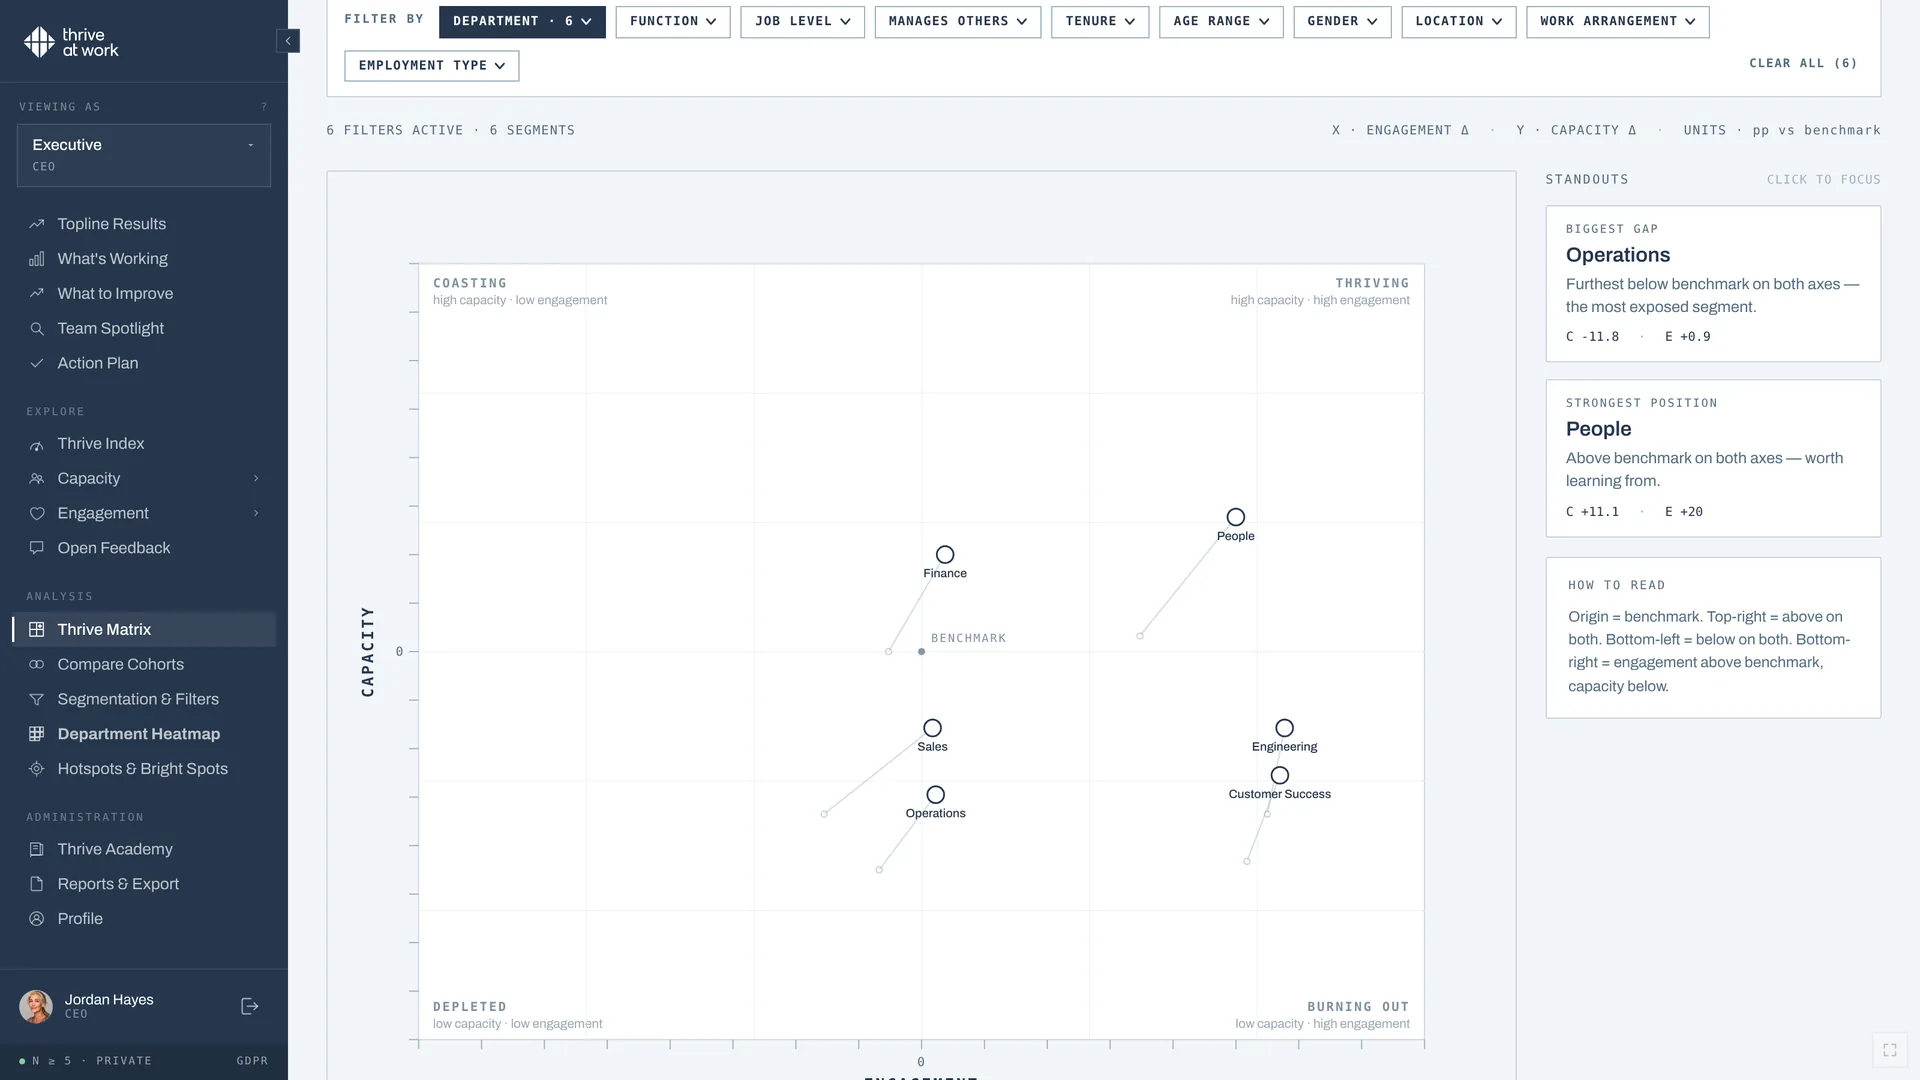
thrive at work places each team on two axes: engagement and capacity. Teams high on both are Thriving. High engagement with low capacity means Burning out: committed people running low. High capacity with low engagement means Coasting. Low on both means Depleted. Each quadrant needs a different response, which is why reading the two together matters more than either score alone. See the thrive matrix.
Workforce performance for finance and operations.
CFOs and COOs care about delivery, cost and risk. Capacity data speaks to all three. Teams with low capacity deliver less priority work on time, lose more days to absence and lose more people, each of which carries a cost. Reading capacity by team before committing to new projects, restructures or growth targets shows where the plan is realistic and where it depends on people running on empty. See the cost of employee turnover and the cost of disengagement.
An example from practice.
A professional services firm planned to grow revenue by taking on two large new clients. Capacity data showed that the two teams who would carry the work were already in the Burning out quadrant: highly engaged, low on energy and recovery. Leadership changed the plan, adding two hires before the second client started and moving one internal project. Six months later both teams had moved toward Thriving, and neither lost a senior person. The example is illustrative, but it shows how capacity data changes decisions before problems appear in the numbers.
What managers need to improve team performance.
Managers improve team performance mostly through everyday decisions: how work is assigned, which meetings happen, how quickly obstacles are removed, how people are recognized and how workload is protected. Workforce performance software helps when it shows each manager where their team stands, which domain is weakest and what to try first. Short, specific suggestions work better than long reports. Managers also need permission to say no to new work when their team is at its limit; data on capacity gives them the evidence to do it.
Workforce performance in hybrid teams.
Hybrid work makes performance harder to see. Managers cannot judge energy from faces in an office, and long online hours can look like commitment when they are a sign of strain. Measuring capacity regularly gives managers a view that does not depend on being in the same room. It also helps teams agree working norms, such as core hours, response times and meeting-free blocks, based on evidence about what is wearing people down rather than on assumptions.
Designing teams for sustainable performance.
Capacity is shaped mostly by how work is designed. Teams sustain performance when priorities are few and clear, work is planned against the people actually available, focus time is protected, decisions are made close to the work and recovery is normal rather than a reward. Workforce performance data shows which of these conditions is missing. A team with low focus scores usually has too many meetings and messages. A team with low recovery usually has work leaking into evenings and weekends. A team with low energy usually has too much work for its size. Each problem has a design fix that managers and leaders can make without asking people to try harder.
Capacity during growth and change.
Periods of growth, restructuring or new technology put the heaviest load on teams. New customers, new systems and new colleagues all arrive at once, while existing work continues. This is when capacity data is most valuable. Measuring before a major change shows which teams can absorb it and which need relief first. Measuring during the change shows whether strain is rising faster than expected. Measuring afterwards shows whether teams recovered or carried the strain into the next quarter. Leaders who use this rhythm make better calls about timing, sequencing and resourcing, and lose fewer good people along the way.
Choosing a platform.
Look for team-level engagement and capacity in one assessment, a simple view leaders understand, action plans managers will use, anonymity people trust, EU hosting and works council documentation where needed, integrations with your HR system and clear links to outcomes you already track. Ask each vendor to show a manager view with realistic data, a team in the Burning out quadrant and how an action is followed up at the next pulse. Then ask a reference customer of similar size what changed in the first year. Platforms that make capacity visible and action simple tend to deliver results quickly; platforms that produce dashboards without clear next steps tend to be abandoned.
Finally, check how the platform fits with tools you already use for goals and reviews. Workforce performance measurement complements performance management; it should not create a second set of processes for managers to run.
First steps.
Baseline every team on engagement and capacity, share the thrive matrix with leaders, agree one priority per team and check it at the next pulse. Bring capacity data into the next quarterly planning round, and ask each leader which commitments depend on teams that are already running low. That single question often changes plans more than any dashboard.
Why it is worth doing.
Teams that are measured on capacity as well as output get relief before they break, and leaders make plans that their people can actually deliver. Over a year, that shows up as steadier delivery, fewer regretted leavers and fewer days lost to absence. It also changes conversations: managers can point to data when they need to say no to more work, and leaders can see the human cost of a plan before they commit to it.
What thrive at work does differently.
Most engagement tools ask how people feel about their work, manager, leadership and company. thrive at work asks that too, and adds a second question: do people have the energy, recovery, focus and resilience to keep performing? The two answers sit side by side as an Engagement Index and a Capacity Index, each from 0 to 100, and place every team on the thrive matrix: Thriving, Burning out, Coasting or Depleted.
That second index matters because a strong engagement score can hide a team that is close to exhaustion. thrive research shows that employees who are highly engaged but burning out lose three times as many days to not working effectively. An engagement-only tool reports those teams as a success.
thrive at work features.
| Feature | What it means in practice |
|---|---|
| Engagement Index | Purpose, leadership, connection and growth, scored 0 to 100 |
| Capacity Index | Energy, recovery, focus and resilience, scored 0 to 100 |
| thrive matrix | Every team placed as Thriving, Burning out, Coasting or Depleted |
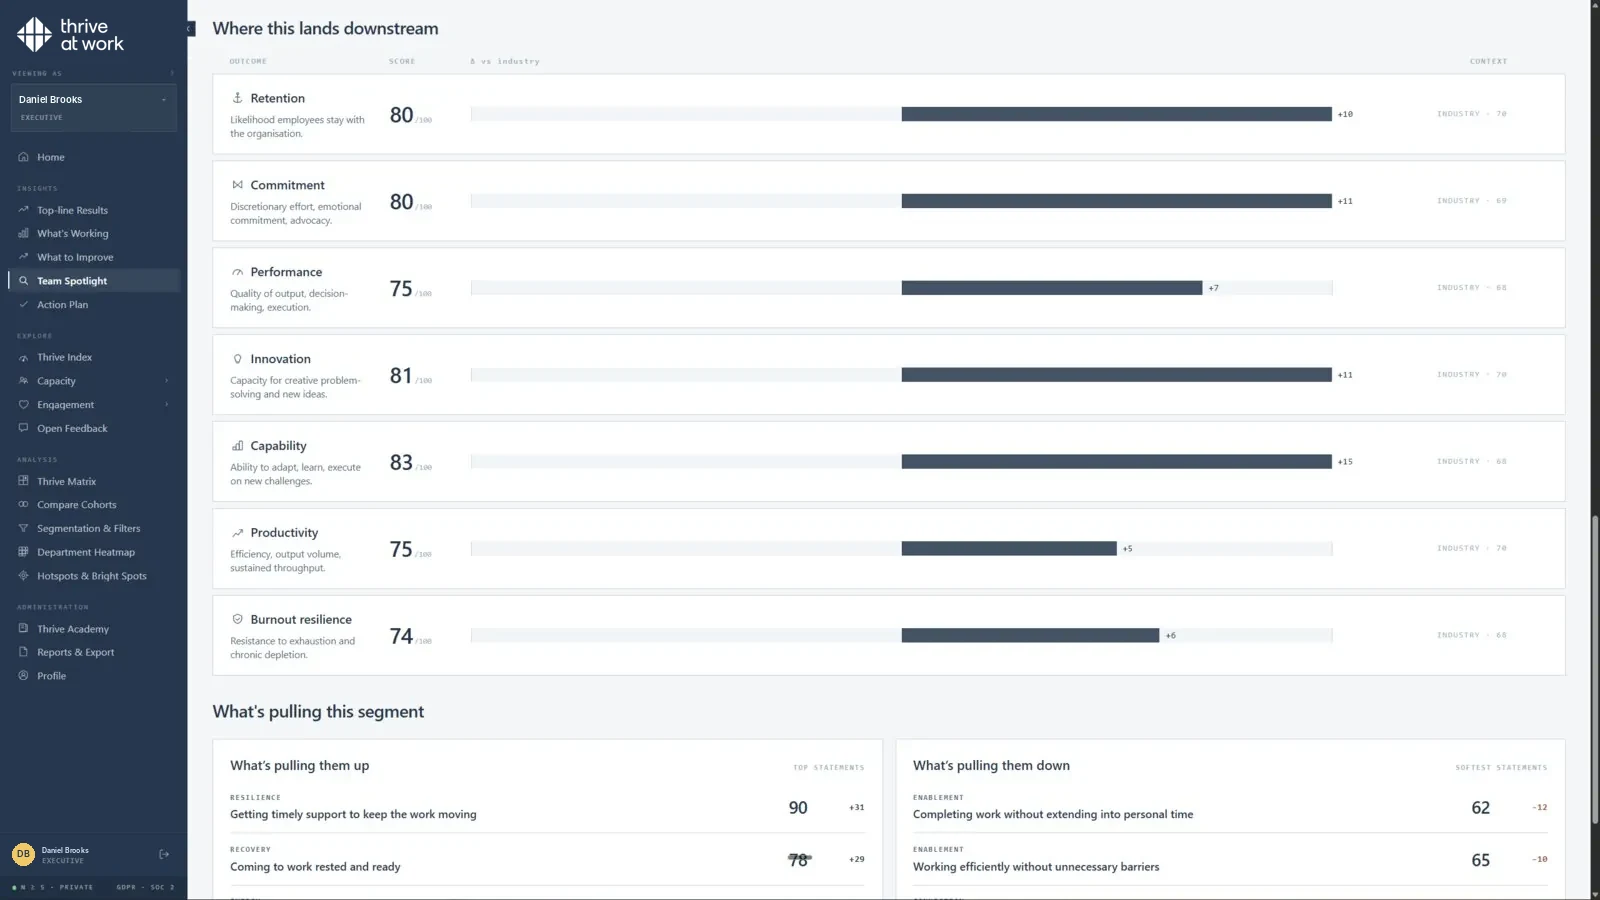
| Team heatmaps and cohort comparisons | See where scores differ by team, location or group |
| Open feedback themes | Comments grouped into themes, with anonymity protected |
| Action plans | Three suggested priorities per team, routed to the manager, the organization or the individual |
| Thrive Academy | More than 300 short courses matched to each person's lowest-scoring area |
| Languages and setup | 13 languages, SSO, HRIS sync or file upload, hosted in the EU |
Workforce performance and performance reviews.
Performance reviews remain useful for individual feedback, development and pay decisions. Workforce performance data adds context: a person in a depleted team may miss goals because of workload, not ability. Reading capacity next to review results helps managers have fairer conversations. See employee performance evaluation.
Workforce performance, goals and OKRs.
Goals and OKRs say what a team should achieve. Workforce performance data says whether the team can achieve it. When goals are set without looking at capacity, teams that are already stretched get the most ambitious targets, and the result is missed goals or burnout. A simple habit helps: before agreeing quarterly goals, look at each team's capacity and workload, and agree what will stop if something new starts. See employee performance goals.
Using capacity in planning.
Before approving a new project, restructure or target, check the capacity of the teams that will carry it. If they are already in the Burning out or Depleted quadrant, decide what stops, what gets help, or whether the timing should change. This takes minutes with the right data and prevents the most expensive mistake in workforce planning: assuming people have energy they do not have.
How to choose workforce performance software.
Decide which question you most need answered: how individuals performed last year, or whether teams can keep delivering next year. For the second, look for team-level measures of engagement and capacity, clear categories leaders understand, action plans managers will use, anonymity people trust and links to the outcomes you already track.
Questions to ask workforce performance vendors.
- 01What do you measure at team level?. And how it relates to delivery and retention.
- 02Which indicators are leading?. Signals that move before output falls.
- 03How do leaders see the whole picture?. A simple view across teams, not fifty charts.
- 04What happens after results?. Action plans, owners and follow-up.
- 05How is individual data protected?. Anonymity and no individual scores from surveys.
- 06How does it fit our existing tools?. HRIS, SSO, performance review software.
Rolling out workforce performance measurement.
- 01Start with leadership. Agree which decisions the data should inform.
- 02Baseline every team. Engagement and capacity in one assessment.
- 03Read results with managers. Plain language, one or two priorities each.
- 04Link to plans. Use capacity data in quarterly planning.
- 05Pulse and re-measure. Check whether actions worked.
- 06Report to the board. Teams by quadrant, trend over time.
Workforce performance glossary.
| Term | Meaning |
|---|---|
| Workforce performance platform | Software that measures the conditions for team performance and helps leaders act |
| Capacity to perform | The energy, recovery, focus and resilience a person has available to sustain performance |
| Engagement | How committed and connected people feel to their work and organization |
| Sustainable workforce performance | Delivering steadily over time without depleting people |
| thrive matrix | Engagement and capacity read together: Thriving, Burning out, Coasting, Depleted |
Bringing it together.
Workforce performance depends on clarity, engagement, capacity, enablement and management. Most performance software covers goals and reviews; a workforce performance platform adds the team-level view of whether people can keep delivering. Reading engagement and capacity together on the thrive matrix gives leaders an early, honest picture and a clear first move for every team.
thrive at work measures engagement (purpose, leadership, connection, growth) and capacity (energy, recovery, focus, resilience) in one anonymous assessment: see how the assessment works.
Workforce performance only tells part of the story when people are running low. thrive at work is a workforce performance platform: an employee engagement platform that measures capacity to perform (energy, recovery, focus and resilience) next to engagement, by team. Read more about employee capacity.
Sources.
- thrive index validation study. thrive at work, 2025–26. Methodology.
Common questions
What is a workforce performance platform?
How is it different from performance management software?
What predicts workforce performance?
Does thrive at work replace performance reviews?
What is capacity to perform?

See which teams can keep delivering.
A 30-minute call shows your teams on the thrive matrix.