


thrive at work/People analytics platform
Buyer guide · Software
People analytics platform: from HR data to decisions.
A people analytics platform brings HR data together so leaders can answer questions about their workforce. The value depends on the questions you ask and the data you can trust.
By Jerry Fiser, Founder & CEO · Reviewed by Marcin Bulik, Research Director · Updated November 8, 2026
What is a people analytics platform?
A people analytics platform combines workforce data, such as headcount, turnover, absence, performance and survey results, so HR and leaders can spot patterns and make decisions. It answers questions like which teams are at risk of losing people, what drives engagement and where workload is unsustainable. Most platforms rely on system data; survey data on engagement and capacity adds the reasons behind the numbers.
- People analytics turns workforce data into decisions about people and teams.
- System data shows what happened; survey data shows why.
- Capacity data, meaning energy, recovery, focus and resilience, is often missing.
- Privacy and group-level reporting matter as much as dashboards.
- Start with a few business questions, not with every data source.
The data a people analytics platform combines.
| Source | Examples | What it shows |
|---|---|---|
| HR system | Headcount, tenure, roles, moves | Who is where |
| Payroll and absence | Sick days, overtime, leave | Strain and cost |
| Recruiting | Time to hire, offer acceptance | Inflow |
| Exits | Turnover, regretted leavers, exit reasons | Outflow |
| Performance | Goals, reviews | Output |
| Surveys | Engagement, capacity, open comments | Why things happen |
Build, buy or combine?
| Option | Strengths | Watch out for |
|---|---|---|
| Build in-house with BI tools | Full control, uses existing data team | Needs analysts, slow to give managers usable views |
| Buy a people analytics platform | Ready-made dashboards and models | Only as good as the data you feed it |
| Combine HR data with a listening platform | Adds the "why" to the "what" | Agree one owner and one set of definitions |
Many mid-size organizations start by combining their HR system reports with a regular survey of engagement and capacity, and add a dedicated analytics tool later.
Questions a people analytics platform should answer.
- 1Where will we lose people next?. Combine engagement, capacity and turnover history by team.
- 2Why do new hires leave early?. Combine onboarding survey results with first-year turnover.
- 3Which teams are overloaded?. Combine capacity scores with overtime and absence.
- 4Do our programs work?. Compare scores and outcomes before and after a change.
- 5What drives performance here?. Relate capacity and engagement to delivery and quality.
Core people metrics.
| Metric | Definition |
|---|---|
| Headcount and FTE | People and full-time equivalents by team |
| Turnover rate | Leavers divided by average headcount |
| Regretted turnover | Leavers the organization wanted to keep |
| Retention rate | Share of starting employees still employed |
| Absence rate | Days lost as a share of planned working days |
| Time to fill | Days from opening a role to acceptance |
| Engagement index | Commitment and connection from surveys |
| Capacity index | Energy, recovery, focus and resilience from surveys |
Agree definitions once and keep them stable so trends mean something. See turnover rate and retention vs turnover.
The gap in most people analytics.
System data is good at counting: who left, how many sick days, how much overtime. It is weak at explaining. By the time turnover or absence rises, the cause has been building for months. Survey data on engagement explains part of it. Capacity data explains more: falling energy, recovery and focus usually come before resignations and sick leave. thrive research found that people with the least capacity delivered 56% of priority work on time, against 86% for those with the most.
Adding capacity to people analytics.
Capacity data is a short set of survey statements about energy, recovery, focus and resilience, asked regularly and reported by team. It fits into people analytics like any other team-level measure. Read it next to overtime, absence and turnover. Teams where capacity falls while overtime rises are under strain; teams where capacity falls and short absences rise are close to the point where people stop coming in. These patterns usually appear months before the turnover report shows a problem. Because the data is anonymous and reported by team, it supports decisions about workload and support without judging individuals.
An example from practice.
A logistics company noticed rising turnover among warehouse supervisors. System data showed who was leaving but not why. Adding a short capacity and engagement survey revealed that supervisors in three sites had very low recovery scores and rising overtime, while engagement remained moderate. Leaders added a second shift lead in each site and limited overtime. Within two quarters, recovery scores improved and supervisor turnover in those sites fell. The example is illustrative, but it shows how combining system data with capacity data turns a turnover report into a decision.

AI in people analytics.
Many platforms now use AI to find patterns, summarize comments and answer questions in plain language. This can make insight faster and more accessible to managers. Use it carefully: AI can surface spurious patterns in small groups, and models that predict outcomes for individuals raise fairness, transparency and legal questions, especially in the EU. Keep AI to group-level analysis and drafting, check its findings against the underlying data, and keep decisions about people with people.
Bringing it together.
A people analytics platform is only as useful as the questions it answers and the actions it leads to. Combine system data with regular measures of engagement and capacity, report at team level, protect privacy and give managers clear next steps. Start with two or three questions leaders care about and grow from there.
Stages of people analytics.
| Stage | Typical question | Example |
|---|---|---|
| Reporting | What happened? | Turnover by department last quarter |
| Diagnosis | Why did it happen? | Exit themes and engagement drivers in high-turnover teams |
| Early warning | What is about to happen? | Teams with falling capacity and rising overtime |
| Action | What should we do? | Workload relief in two teams, manager coaching in a third |
Most organizations get the most value by moving from reporting to early warning, not by building complex prediction models.
People analytics use cases.
- 1Early warning on burnout. Teams where capacity falls and overtime rises.
- 2Manager effectiveness. Engagement and turnover by manager, read with care and context.
- 3Onboarding quality. First-year turnover and onboarding survey results.
- 4Workforce planning. Capacity scores before adding projects or cutting roles.
- 5Program evaluation. Before and after measures for training or wellbeing programs.
- 6AI rollout impact. Energy and focus by team before and after new tools.
Features to look for in a people analytics platform.
- 01Reliable integrations. Automatic sync with your HR system and other sources.
- 02Team-level views. Results by team, location and group, not just company averages.
- 03Privacy by design. Minimum group sizes, role-based access, no individual scores from surveys.
- 04Survey data built in. Engagement and capacity alongside system data.
- 05Clear visuals for managers. Readable without analyst training.
- 06Action, not just insight. Suggested priorities that managers can act on.
Privacy and ethics in people analytics.
Workforce data is personal and sensitive. Report at group level, limit who sees what, explain to employees what is collected and why, and avoid using analytics to judge individuals without their knowledge. In the EU, many AI systems used for decisions about people count as high-risk under the AI Act, and Article 26 of the EU AI Act requires employers to inform workers' representatives and affected workers before using them. Read more about people analytics.
Governance for people analytics.
Decide who owns the data, who can see which views, and how insights are used. Write down what people analytics will not be used for, such as judging individuals from survey data. Involve employee representatives early. Review access rights regularly. These steps protect trust, and trust is what keeps survey data honest.
Explaining people analytics to employees.
Tell employees what data is used, why, who sees results and what it will never be used for. People accept analytics that improves their work; they resist analytics that feels like surveillance.
What thrive at work does differently.
Most engagement tools ask how people feel about their work, manager, leadership and company. thrive at work asks that too, and adds a second question: do people have the energy, recovery, focus and resilience to keep performing? The two answers sit side by side as an Engagement Index and a Capacity Index, each from 0 to 100, and place every team on the thrive matrix: Thriving, Burning out, Coasting or Depleted.
That second index matters because a strong engagement score can hide a team that is close to exhaustion. thrive research shows that employees who are highly engaged but burning out lose three times as many days to not working effectively. An engagement-only tool reports those teams as a success.
thrive at work features.
| Feature | What it means in practice |
|---|---|
| Engagement Index | Purpose, leadership, connection and growth, scored 0 to 100 |
| Capacity Index | Energy, recovery, focus and resilience, scored 0 to 100 |
| thrive matrix | Every team placed as Thriving, Burning out, Coasting or Depleted |
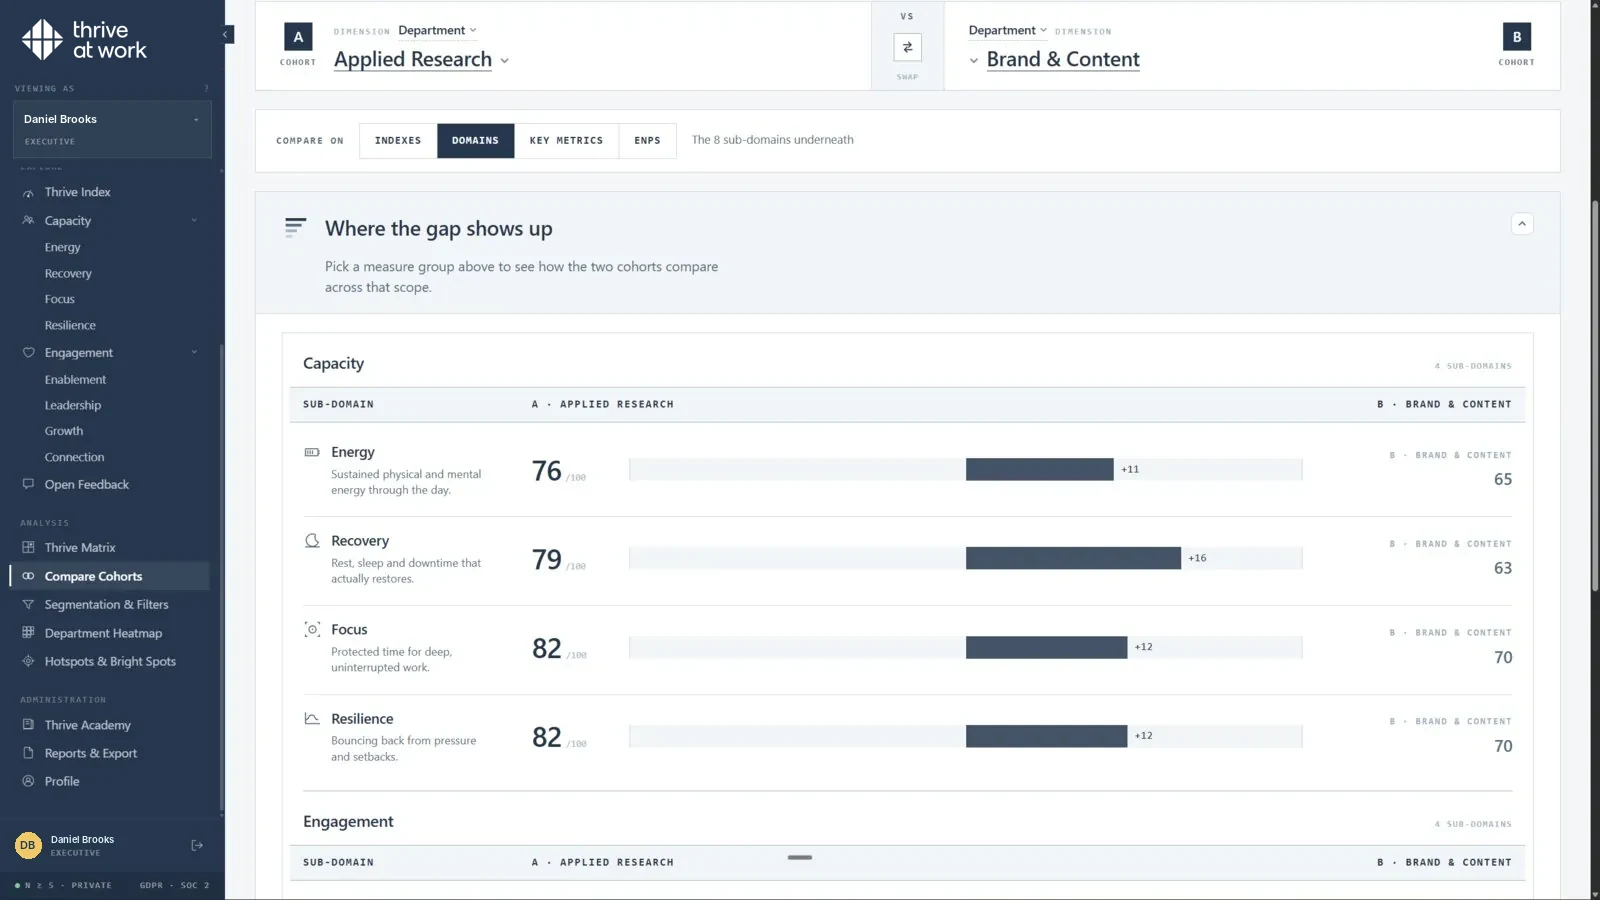
| Team heatmaps and cohort comparisons | See where scores differ by team, location or group |
| Open feedback themes | Comments grouped into themes, with anonymity protected |
| Action plans | Three suggested priorities per team, routed to the manager, the organization or the individual |
| Thrive Academy | More than 300 short courses matched to each person's lowest-scoring area |
| Languages and setup | 13 languages, SSO, HRIS sync or file upload, hosted in the EU |
How to get started with people analytics.
Pick two or three questions leadership cares about, such as regretted turnover in key teams or burnout risk in a growing department. Gather only the data needed to answer them. Add a regular survey that measures engagement and capacity by team. Share findings with managers in plain language, agree actions and check the same measures three months later. Expand from there.

Skills a people analytics team needs.
| Skill | Why it matters |
|---|---|
| Business questions | Turns curiosity into decisions leaders care about |
| Data handling | Joins and cleans data from several systems |
| Statistics | Separates real patterns from noise, especially in small teams |
| Storytelling | Makes findings clear for managers |
| Ethics and privacy | Keeps analysis fair and lawful |
Small teams can cover these with one analyst, an HR business partner and support from IT, plus a platform that does the heavy lifting.
People analytics for mid-size organizations.
Mid-size organizations rarely have a data science team, but they can still get most of the value. Combine HR system reports with a regular survey of engagement and capacity, agree a handful of metrics and review them quarterly by team. That covers the questions leaders ask most often.
A quarterly people review.
Once a quarter, review headcount, regretted turnover, absence, engagement and capacity by team in one meeting with leaders. Pick the three teams that need attention most, agree an action for each and check it next quarter. This simple routine turns people analytics from reporting into decisions, without needing complex models or a large analytics team.
Data quality first.
Analytics built on wrong team assignments or outdated records misleads leaders. Check team structures, manager assignments and leaver records before every major analysis, and fix errors at the source system so they do not come back.
Common people analytics mistakes.
- 1Starting with data, not questions. Dashboards nobody uses.
- 2Trusting small numbers. A team of six cannot show reliable trends month to month.
- 3Predicting individuals. Erodes trust and raises legal risk.
- 4Ignoring the why. System data without survey data explains little.
- 5No action owner. Insights that nobody is responsible for acting on.
thrive at work measures engagement (purpose, leadership, connection, growth) and capacity (energy, recovery, focus, resilience) in one anonymous assessment: see how the assessment works.
People analytics numbers only show who has already gone. thrive at work is a workforce performance platform: an employee engagement platform that reads engagement next to capacity to perform, so you can spot the teams at risk months earlier. Read more about employee engagement.
Sources.
- Article 26 of the EU AI Act. artificialintelligenceact.eu
- thrive index validation study. thrive at work, 2025–26. Methodology.
Common questions
What does a people analytics platform do?
What is the difference between people analytics and HR reporting?
What data do you need for people analytics?
Is people analytics legal under GDPR?
Why add capacity data to people analytics?

Add the data your analytics is missing.
A 30-minute call shows how engagement and capacity data fit your people analytics.