


thrive at work/Employee engagement software
Buyer guide · Software
Employee engagement software: how to choose the right tool.
Employee engagement software helps organizations ask employees how they are doing, see the results by team and act on them. The tools look similar in demos. They differ in what they measure and what managers can do next.
By Jerry Fiser, Founder & CEO · Reviewed by Marcin Bulik, Research Director · Updated November 8, 2026
What is employee engagement software?
Employee engagement software runs surveys that measure how committed and connected employees feel, shows the results by team and helps managers act on them. Most tools offer an annual survey, shorter pulse surveys, dashboards, benchmarks and action planning. The best tools also show whether people have the energy and capacity to keep performing, not only whether they are engaged.
- Engagement software runs surveys, shows results by team and supports action.
- Core features are similar; differences are in what is measured and what happens next.
- An engagement score alone can hide teams that are close to burnout.
- Check anonymity, languages, integrations, data hosting and manager support.
- thrive at work measures engagement and capacity in one assessment.
What employee engagement software does.
At its simplest, engagement software replaces a spreadsheet survey with a system: it sends questions, protects anonymity, analyzes answers and shows results to the right people. Most tools now cover the full cycle from listening to action.
| Stage | What the software does |
|---|---|
| Listen | Annual surveys, pulse surveys, lifecycle surveys such as onboarding and exit |
| Analyze | Scores by team, drivers, open-comment themes, comparisons and benchmarks |
| Share | Dashboards for leaders, team reports for managers |
| Act | Action plans, suggested priorities, follow-up and tracking |
| Repeat | Trend lines so you can see whether changes worked |
Types of employee engagement software.
- 1Survey-first platforms. Built around engagement surveys and analytics.
- 2Performance suites with engagement. Reviews, goals and one-to-ones, with surveys added.
- 3HR suites with a survey module. Part of a wider HR system, often simpler.
- 4Recognition and communication apps. Shout-outs, intranets and social feeds, sold as engagement.
- 5Engagement and capacity platforms. Measure engagement and the energy to perform together.
Well-known employee engagement software tools.
The market has many vendors. These are the names buyers most often compare. Each has strengths; the right choice depends on what you need to measure and what systems you already run.
| Tool | What it is | Our comparison |
|---|---|---|
| Culture Amp | Employee experience platform covering engagement surveys, performance and development | Culture Amp alternative |
| Qualtrics EmployeeXM | Employee listening within the wider Qualtrics experience management suite | Qualtrics alternative |
| Workday Peakon Employee Voice | Continuous listening platform with deep Workday HCM integration | Peakon alternative |
| Lattice | People platform built around performance, with engagement, goals and compensation | Lattice alternative |
| Leapsome | All-in-one HR and talent platform with engagement surveys | Leapsome alternative |
| Microsoft Viva Glint | Engagement surveys inside Microsoft Viva, sold as a Microsoft 365 add-on | Viva Glint alternative |
| 15Five | Performance management and engagement for managers and teams | 15Five alternative |
| Gallup Q12 | A twelve-statement engagement survey with Gallup benchmarks | Gallup Q12 alternative |
| thrive at work | Engagement and capacity to perform measured together, read on the thrive matrix | Employee engagement platform |
Descriptions are based on each vendor's public material, reviewed November 2026. Our comparison pages go into detail on each.
Features that matter in engagement software.
- 01Measures what you need. Engagement drivers, and whether people have the capacity to perform.
- 02Protects anonymity. A minimum group size before results show, and no individual scores.
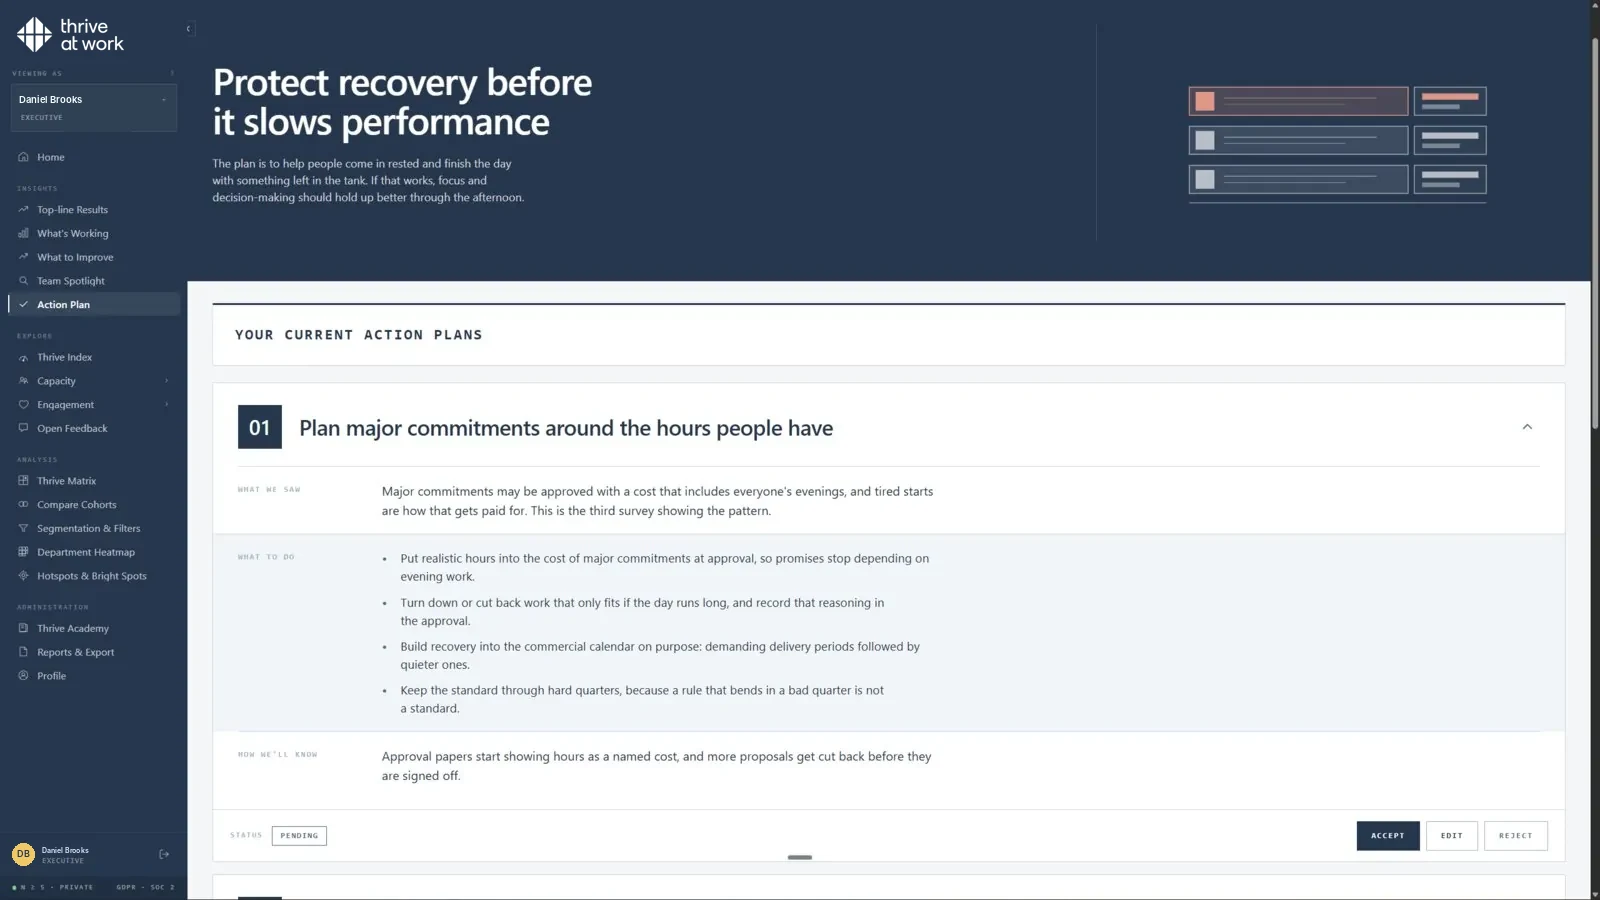
- 03Gives managers a plan. Results arrive with clear next steps, not just charts.
- 04Works in your languages. Same questions, properly translated, for every team.
- 05Fits your systems. SSO, HRIS sync or a simple employee file upload.
- 06Handles data properly. Where data is hosted, who can see it, how long it is kept.
- 07Shows trends. Stable core questions so you can compare over time.
- 08Works with employee representatives. Documentation that supports works council and privacy reviews.
Why organizations buy engagement software.
Most organizations start looking for engagement software after a specific trigger: rising turnover in key teams, a merger or restructure, a new CEO who wants to hear from employees, a burnout problem that surfaced too late, or a spreadsheet survey that became impossible to manage. Naming the trigger helps choose the tool. If the problem is turnover in engaged, high-performing teams, an engagement-only survey may miss the cause. If the problem is low trust after a restructure, leadership and communication drivers matter most. If the problem is scale, integrations and automation come first.
It also helps to be honest about what software cannot do. It cannot make managers have better conversations, and it cannot fix workload. It can show where those things are needed, quickly and by team, and make it easier to act and to check whether action worked.
Signs you have outgrown your current approach.
Most organizations do not switch engagement tools on a whim. The signs usually build over a year or two. Survey participation falls because people no longer believe anything will change. Managers say the reports are hard to read, so they wait for HR to explain them, and by the time the explanation arrives the moment has passed. Leaders ask questions the tool cannot answer, such as which teams are close to burning out or whether a reorganization made things better. Exit interviews mention workload and exhaustion, yet the engagement scores for those teams looked healthy.
Each of these points to a different gap. Falling participation is a trust and action problem. Unreadable reports are a design problem. Unanswerable questions are a measurement problem. And healthy scores in teams that are losing people usually mean the survey measures commitment but not capacity. Naming the gap before you look at vendors keeps the search focused on what will actually change outcomes.
Who should be involved in choosing.
Engagement software touches many people, so the buying group matters. HR usually leads, but managers decide whether results lead to change, so include two or three of them in demos. IT checks integrations, single sign-on and security. The data protection officer checks hosting, retention and data flows. In works council countries, employee representatives should see the questions, anonymity rules and reporting levels early. Finance wants to understand total cost and the business case. A senior leader should sponsor the project, because the most important actions after a survey often need leadership decisions.
Agree the decision criteria before the first demo and score each vendor against the same list. It keeps the choice focused on what matters to your organization rather than on the most impressive presentation.
What engagement software should measure.
Most tools measure engagement through statements grouped into drivers. Common drivers include purpose, leadership, manager support, connection with colleagues, growth, recognition and voice. The outcome is usually a commitment measure such as intent to stay or willingness to recommend the organization.
Good tools keep a stable core so you can compare over time, and let you add a few statements for local topics. Fewer, better questions beat long surveys: response quality falls when a survey runs past about fifteen minutes. See employee engagement survey questions for examples.
Scales, benchmarks and statistics.
Look at how scores are calculated. Some tools report a percentage of favorable answers, others an average or an index. Neither is wrong, but you should know which you are looking at before you compare teams or vendors.
Benchmarks show how your scores compare with other organizations. They are useful for context and dangerous as targets: a team at the benchmark can still be exhausted. The most useful comparison is usually a team against its own history and against similar teams inside your organization.
The blind spot in most engagement tools.
Engagement measures how people feel about their work. It does not measure whether they can keep going. A team can score high on commitment while its energy and recovery fall, and that team looks like a success until people start leaving. The engagement and burnout paradox explains why this happens and why it is common in the most committed teams.
Why engaged teams still burn out.
Engagement and burnout are often assumed to be opposites. In practice, they can rise together. Engaged people care about the work and the people they work with, so they take on more, stay later and keep going when others would stop. For a while, the engagement score stays high. Then energy runs out, recovery stops working, mistakes increase and people start to withdraw or leave. By the time the engagement score drops, the damage is done.
This is why measuring capacity alongside engagement matters. A team with high engagement and falling capacity is the clearest early warning an organization can get. Engagement software that does not measure capacity reports that team as a success until the resignations arrive.
How often engagement software should survey.
There is no single right rhythm, but there are patterns that work. A broad survey once a year sets the baseline and covers every driver. Short pulses between broad surveys, every one to three months, track the few measures that matter most right now and check whether actions worked. Weekly pulses tend to tire people unless they are very short and clearly used. The rule of thumb is simple: never survey faster than you can act. If teams have not discussed the last results, the next survey will only measure frustration.
Capacity measures benefit from a steadier rhythm than engagement drivers, because energy and recovery change faster. A short capacity check in every pulse lets you see strain building during busy periods and recovering afterwards, which helps leaders decide when to push and when to protect people.
What to put in a pulse.
A good pulse has three parts. A small stable core, perhaps five statements, tracks the measures that matter most over time: overall engagement, intent to stay, workload, energy and recovery. A rotating block of two or three statements follows up on the priorities teams chose after the last survey, so people can see whether their actions are working. And one open question invites people to say what has changed or what still needs attention. Keeping the pulse to this shape makes it quick to answer, easy to compare and clearly connected to action, which is what keeps participation high over many cycles.
Avoid the temptation to add questions each time someone has a new idea. Every extra statement makes the pulse longer and the results harder to read. Park new questions for the next broad survey unless a real decision depends on them now.
The team conversation after results.
The most important moment in any engagement program is not the survey but the conversation that follows it. A good team conversation takes about an hour. The manager thanks people for taking part, shares the headline results honestly, including the weaker ones, and asks the team what lies behind the lowest scores. The team then agrees one or two changes it can make itself and names anything that needs a decision from leadership. Someone writes the actions down with owners and dates. The manager closes by saying when the team will check progress, usually at the next pulse. Software helps by preparing the summary, suggesting actions and recording what was agreed, but the conversation itself is what changes how people feel about the next survey.
What leaders must do.
Leaders decide whether engagement software becomes a habit or a ritual. They should share company-wide results personally, name the two or three organization-level changes they will make, and report back on them at the next pulse. Many of the biggest drivers of engagement and capacity, such as workload, priorities and staffing, sit with leadership rather than with team managers, so visible leadership action matters most.
Anonymity in engagement software.
Honest answers depend on trust that individual responses cannot be traced. Good engagement software protects this in several ways. It sets a minimum group size below which results are not shown. It stops users from combining filters, such as team, age band and tenure, to isolate a small group. It treats open comments carefully, because people sometimes reveal who they are in what they write. And it limits who can see raw data at all.
Explain these rules clearly in every survey invitation. People do not read privacy policies, but they do read a short sentence that says "your manager sees results only for groups of at least a set number of people, never individual answers". In works council countries, agree the rules with employee representatives before the first survey; it saves time and builds trust from the start.
Getting your data ready.
The single biggest cause of delay in engagement software projects is not the software but the employee data behind it. Results are only as useful as the team structure they are reported against. Before launch, check that every person sits in the right team, that managers are correctly assigned, that locations and departments use consistent names, and that people who left are removed. Decide which groups you want to compare, such as tenure bands or work locations, and make sure the data supports them without creating groups too small to report. An hour spent cleaning data before launch saves weeks of confusion after it.
Your first survey with new software.
The first survey sets expectations for every survey after it. Keep it focused: a broad set of engagement and capacity statements, two open questions and nothing you are not prepared to act on. Communicate clearly before launch: why you are asking, who sees what, when results will be shared and what will happen next. Ask managers to encourage participation personally. Keep the survey open for two to three weeks with a couple of reminders.
After it closes, share headline results with everyone within two weeks, even before team reports are ready. Then give each manager their team report, a short guide to the team conversation and a deadline to agree one or two actions. Report back on progress at the first pulse. Organizations that follow this pattern usually see participation hold or rise in the second round, which is the best early sign that the program is working.

What managers need from engagement software.
Managers decide whether a survey leads to change. They need results they can read in a few minutes, a clear view of the one or two things that matter most for their team, and suggested actions they can start that week. Tools that give managers a raw dashboard and a long list of drivers often produce nothing, because nobody knows where to begin.
| Manager need | What good software does |
|---|---|
| Understand results quickly | Short summary, top strengths and top priorities |
| Know what to do | Suggested actions linked to the lowest drivers |
| Talk to the team | A guide for the results conversation |
| Follow through | Reminders and a way to record progress |
| See if it worked | Trend at the next pulse |
What thrive at work does differently.
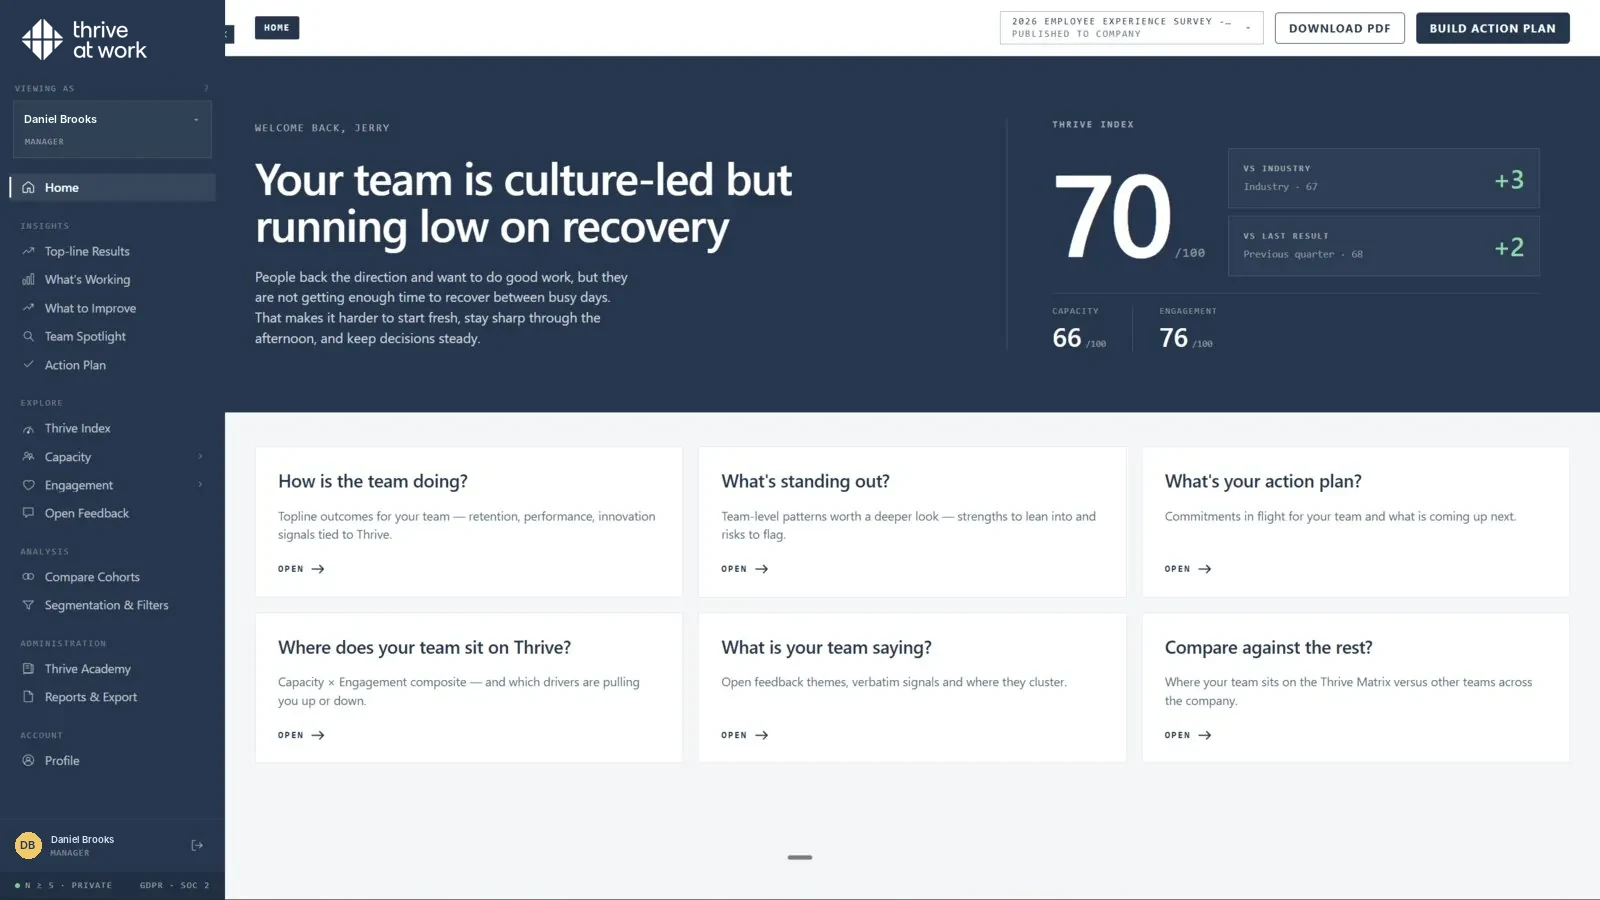
Most engagement tools ask how people feel about their work, manager, leadership and company. thrive at work asks that too, and adds a second question: do people have the energy, recovery, focus and resilience to keep performing? The two answers sit side by side as an Engagement Index and a Capacity Index, each from 0 to 100, and place every team on the thrive matrix: Thriving, Burning out, Coasting or Depleted.
That second index matters because a strong engagement score can hide a team that is close to exhaustion. thrive research shows that employees who are highly engaged but burning out lose three times as many days to not working effectively. An engagement-only tool reports those teams as a success.

The four capacity domains.
| Domain | What it covers | What low scores often mean |
|---|---|---|
| Energy | Physical and mental energy across the working day | Workload is too high or recovery too short |
| Recovery | Whether people can switch off and recharge | Work reaches into evenings, weekends and leave |
| Focus | Ability to concentrate on important work | Too many meetings, messages and context switches |
| Resilience | Ability to handle pressure and setbacks | Sustained strain with little support |
Read more about each domain: energy, recovery, focus and resilience.
The four engagement domains.
| Domain | What it covers |
|---|---|
| Purpose | Whether people see meaning in their work and how it contributes |
| Leadership | Trust in leaders and in the direction of the organization |
| Connection | Belonging, teamwork and relationships with colleagues |
| Growth | Learning, development and a future in the organization |
Engagement and capacity are related but different. A team can care deeply about its purpose and still be running low on energy.
thrive at work features.
| Feature | What it means in practice |
|---|---|
| Engagement Index | Purpose, leadership, connection and growth, scored 0 to 100 |
| Capacity Index | Energy, recovery, focus and resilience, scored 0 to 100 |
| thrive matrix | Every team placed as Thriving, Burning out, Coasting or Depleted |
| Team heatmaps and cohort comparisons | See where scores differ by team, location or group |
| Open feedback themes | Comments grouped into themes, with anonymity protected |
| Action plans | Three suggested priorities per team, routed to the manager, the organization or the individual |
| Thrive Academy | More than 300 short courses matched to each person's lowest-scoring area |
| Languages and setup | 13 languages, SSO, HRIS sync or file upload, hosted in the EU |
Questions to ask engagement software vendors.
- 01What exactly do you measure?. Ask for the full list of statements and drivers, and what is not covered.
- 02How do you protect anonymity?. Minimum group size, filter combinations, comment handling.
- 03What does a manager see?. Ask for a live demo of the manager view, not the admin view.
- 04How are actions suggested?. Generic tips or specific to the team's results?
- 05Where is data hosted and processed?. Region, subprocessors, retention periods.
- 06How do you support works councils?. Documentation, data flow descriptions, reporting levels.
- 07Which languages are included?. Professionally translated, or machine translation?
- 08How do integrations work?. SSO, HRIS sync, file upload, and how often data refreshes.
- 09What does implementation take?. Timeline, roles on both sides, first survey date.
- 10How do you measure burnout risk?. Do you score energy, recovery and focus, or only engagement?
How to compare engagement software.
Ask each vendor the same questions and run the same short trial. Useful questions: what exactly does your survey measure, and what does it miss? How is anonymity protected in small teams? What does a manager see the day after results arrive? How are action plans created? Where is our data hosted and processed? How do you support works council and privacy reviews? Our comparisons of Culture Amp, Qualtrics, Workday Peakon, Lattice, Leapsome and Microsoft Viva Glint cover these points.
How to run a good demo.
Ask each vendor to show the same scenario with realistic data: a manager of a team of twelve opens results the day after a survey closes. What do they see first? What do they do next? How long does it take to understand the top priority? Then ask to see a team below the anonymity threshold, an open-comment theme, and how an action is tracked to the next pulse. Score each vendor on the same sheet, and include two managers in the panel.
| Demo check | Score 1 to 5 |
|---|---|
| Manager understands results in under five minutes | |
| Top priority is clear | |
| Suggested actions fit the results | |
| Anonymity handling is visible | |
| Burnout risk is shown, not only engagement | |
| Trend to next pulse is easy to see |
Engagement software by company size.
| Company size | What usually matters most |
|---|---|
| Under 250 employees | Simple setup, ready-made questions, manager reports without training |
| 250 to 5,000 | Team-level insight, languages, HRIS integration, action plans, privacy reviews |
| 5,000 and more | Complex hierarchies, global rollout, advanced analytics, governance |
A typical implementation timeline.
| Week | Main tasks |
|---|---|
| 1 | Kick-off, goals, project roles, employee data structure |
| 2 | Integrations or file upload, team hierarchy, languages |
| 2 to 3 | Privacy review, works council documentation where needed |
| 3 | Communication plan, manager briefing |
| 4 to 6 | Survey open for two to three weeks with reminders |
| 6 to 8 | Results to leaders and managers, team conversations, action plans |
Timelines depend mostly on data quality and internal approvals, not on the software.
Change management for a new engagement tool.
A new tool changes routines for leaders, managers and employees. Explain why you are changing, what will be different and what stays the same. Brief managers before employees, so they can answer questions. Keep a few core statements from the old survey if you can, so people see continuity. And make the first round about acting quickly on two or three visible priorities; that builds trust in the new tool faster than any launch campaign.
The business case for engagement software.
The case rests on outcomes the organization already tracks: voluntary turnover, absence, productivity and burnout. Software earns its cost when it helps managers act earlier on the teams at risk. That is why measuring capacity matters for ROI: falling energy and recovery usually show up months before resignations and sick leave. See the cost of employee turnover for how to put numbers on it.
A worked example of the business case.
Take an organization of 1,000 people with 15% voluntary turnover, so 150 leavers a year. If replacing one person costs a substantial share of an annual salary in recruiting, onboarding and lost output, even a small reduction in turnover is worth a lot. If better listening helps managers keep ten more people a year, the savings usually exceed the cost of the software many times over. Use your own salary and turnover figures; the cost of turnover guide shows the calculation.
The same logic applies to absence and burnout. Teams that are running low on energy show it in sick days and errors long before they show it in resignations.
Linking engagement to business outcomes.
Engagement software earns its place when results connect to outcomes leaders already track. Start simple: put team engagement and capacity scores next to voluntary turnover, absence and delivery for the same teams. Look for teams where the measures move together. Over two or three cycles, this shows which scores give early warning in your organization. thrive research found that people with the least capacity delivered 56% of priority work on time, against 86% for those with the most, a link most engagement-only tools cannot show.
How engagement software is usually priced.
Vendors typically price per employee per year, often with a minimum contract size, and sometimes add fees for modules, languages, integrations or consulting. Some include unlimited surveys; others charge per survey type. When comparing, look at the total cost for your headcount over two or three years, including internal time for setup and analysis. A cheaper tool that managers do not use is the most expensive option. Ask each vendor for a quote based on your headcount and needs.
Where engagement software is heading.
Three shifts are changing the category. First, AI is being used to summarize comments and suggest actions, which saves time but needs careful handling of individual data. Second, buyers increasingly want to know not only whether people are engaged but whether they can sustain their performance, which is why capacity and burnout risk are moving to the center of the conversation. Third, organizations want fewer, better surveys with clearer links to outcomes such as retention and delivery. Tools that measure what matters, protect trust and help managers act will keep their place; tools that only produce dashboards will struggle.
More questions buyers often ask.
Can we keep our old questions? Usually yes, at least a core set, which helps you compare trends. Check that the new tool can import historical results or at least match statement wording. Should we survey everyone or a sample? For engagement and capacity, survey everyone, so every team gets results and every person feels heard. How do we handle teams that are too small to report? Combine them with a neighboring team for reporting, and explain this in advance. What if results are bad? Share them anyway. People already know when things are difficult; hiding results destroys trust faster than any score.
How soon will we see change? Visible actions after the first survey can lift scores within one or two pulses. Deeper changes in culture and workload take longer. Measure regularly, keep the core stable and judge progress over a year, not a month.
Rolling out engagement software.
- 01Agree the purpose. What decisions will the results inform?
- 02Involve employee representatives. Early, especially in Germany and other works council countries.
- 03Communicate anonymity. Explain clearly who sees what.
- 04Launch and remind. Two to three weeks, with manager encouragement.
- 05Share results fast. Within two to four weeks, by team.
- 06Act and report back. One or two visible changes per team.
Why engagement software fails to deliver.
- 1Survey and forget. Results are shared late or not at all, so people stop answering.
- 2Too many priorities. Managers get ten drivers to fix and act on none.
- 3HR owns everything. Leaders and managers treat it as an HR exercise.
- 4Over-surveying. Monthly long surveys tire people and lower honesty.
- 5Engagement only. Teams that look engaged but are close to exhaustion are missed.
- 6No link to outcomes. Scores are never read next to turnover, absence or delivery.
Security and privacy checklist.
| Check | Why it matters |
|---|---|
| Data hosting region | Required by many European buyers and works councils |
| Encryption in transit and at rest | Basic protection of survey data |
| Role-based access | Leaders, HR and managers see only what they should |
| Minimum reporting group | Protects anonymity in small teams |
| Comment handling | Removes or warns about identifying details |
| Data retention and deletion | Clear periods and deletion on request |
| Certifications and audits | Evidence of security controls |
| Subprocessor list | Who else handles your data |
Engagement software glossary.
| Term | Meaning |
|---|---|
| Engagement | How committed and connected people feel to their work and organization |
| Driver | A factor that influences engagement, such as manager support or growth |
| Pulse survey | A short, frequent survey on a few key measures |
| eNPS | Employee Net Promoter Score: how likely people are to recommend the employer |
| Favorability | The share of answers in the agree categories |
| Heatmap | A table showing scores by team and topic |
| Capacity | The energy, recovery, focus and resilience people have available to sustain performance |
| Action plan | Agreed steps a team takes after results |
Engagement software by industry.
| Industry | Typical priorities |
|---|---|
| Professional services | Workload, utilization pressure, burnout in high performers |
| Technology | Growth, focus time, change fatigue |
| Healthcare | Shift work, recovery, staffing pressure |
| Manufacturing and logistics | Frontline access, languages, safety and supervisor support |
| Financial services | Change, regulation, long hours in specific teams |
| Retail and hospitality | Turnover, scheduling, mobile access |
Pick software that reaches your whole workforce, including people without a company email address or desk.
Engagement software for mid-size organizations.
Organizations of 250 to 5,000 people often sit in an awkward middle. They are too large for informal check-ins to reach everyone, but too small for a dedicated people analytics team. They need software that is quick to set up, readable by managers without training and strong on anonymity in small teams, because many of their teams have fewer than ten people. They also tend to feel workload pressure sharply: one person leaving a team of eight changes everyone's week. That makes capacity measurement especially useful, because it shows strain before it turns into resignations that are hard to replace.
A final buying checklist.
Before you sign, check five things. First, that the survey measures what your leaders actually need to know, including whether teams can sustain their performance and not only whether they are committed. Second, that managers in your demo panel could read their report and name a first action within five minutes. Third, that anonymity rules suit your smallest teams and have been agreed with employee representatives where that applies. Fourth, that integrations, languages and data hosting are confirmed in writing, not just in a slide. Fifth, that you have a plan and dates for sharing results and acting on them before the first survey opens.
If any of these is unclear, resolve it before launch. Most disappointing engagement programs fail on one of these five points, not on the software itself. A clear purpose, a manager-friendly tool, trusted anonymity, solid data and a visible plan for action are what turn a survey into better outcomes for people and for the business.
thrive at work measures engagement (purpose, leadership, connection, growth) and capacity (energy, recovery, focus, resilience) in one anonymous assessment: see how the assessment works.
Good engagement software work needs a survey people trust and results managers can act on. In Employee Experience Management (EXM) terms, thrive at work is an employee engagement platform that measures engagement and capacity to perform in one anonymous survey. See the employee survey platform or read more about employee engagement.
Sources.
- thrive index validation study. thrive at work, 2025–26. Methodology.
Common questions
What is the best employee engagement software?
What features should employee engagement software have?
How much does employee engagement software cost?
Is an engagement survey enough to prevent burnout?
How long does it take to implement engagement software?

See engagement and capacity side by side.
A 30-minute call shows what your teams would see on the thrive matrix.