


thrive at work/Employee retention software
Buyer guide · Software
Employee retention software: see who is about to leave.
Turnover reports tell you who has already gone. Retention software is meant to show who might go next, and why, while there is still time to act.
By Jerry Fiser, Founder & CEO · Reviewed by Marcin Bulik, Research Director · Updated November 8, 2026
What is employee retention software?
Employee retention software helps organizations spot turnover risk early and act on it. It combines signals such as engagement, capacity, workload, absence and exit data, shows which teams are at risk and suggests actions for managers. The most useful tools measure why people might leave, not just predict that they will.
- Retention software aims to show turnover risk before resignations.
- The strongest early signals are falling engagement and falling capacity.
- Team-level insight beats individual "flight risk" scores for trust and action.
- Managers need clear next steps, not just a risk list.
- Measure regularly so you can see whether actions worked.
Early signals of turnover risk.
| Signal | Where it comes from | Why it matters |
|---|---|---|
| Falling engagement | Surveys | Commitment drops before people start looking |
| Falling capacity | Surveys on energy, recovery, focus | Exhaustion is one of the most common reasons good people leave |
| Rising overtime | Time and payroll data | Sustained overload drives burnout |
| More short absences | Absence data | Often an early sign of strain |
| Lower intent to stay | Surveys | A direct but late signal |
| Manager change | HR system | A new manager is a common turning point |
Why people leave, and what software can see.
People rarely leave for one reason. Common themes in exit data are the manager relationship, lack of growth, pay, workload and burnout. Software cannot fix any of these, but it can show where they are building. Engagement data covers manager, growth and purpose. Capacity data covers workload and exhaustion, the part most engagement surveys miss. Read more in engagement and retention.
Stay interviews and retention software.
Software shows where risk is building. Stay interviews show what to do about it. A short conversation with people who are staying, asking what keeps them, what frustrates them and what might make them leave, gives managers specific actions. Good questions: "What do you look forward to at work?" "What would make you think about leaving?" "What is one thing I could change to make your work better?"

Team insight vs individual "flight risk" scores.
Some tools predict which individuals will leave. That raises trust and privacy questions, and in the EU, AI systems used for decisions about individual employees can fall under the AI Act's high-risk rules. Team-level insight is usually more useful anyway: managers can change workload, recognition and growth for a whole team, and anonymous data keeps people answering honestly.
Using exit data well.
Exit surveys and interviews tell you why people leave, but only if you read them in aggregate and act on the themes. Group reasons into manager, growth, pay, workload and personal reasons, and count them by team and role. A theme that appears repeatedly in one team is a team problem; a theme that appears everywhere is an organization problem. Remember the limits: people often give the most comfortable reason rather than the real one, and by the time they leave it is too late. Combine exit data with regular measures of engagement and capacity to act earlier.
Retaining new hires.
Many organizations lose a large share of their leavers in the first year. Early turnover is expensive because recruiting and onboarding costs are spent without a return. Retention software helps when it includes onboarding surveys at 30, 60 and 90 days and reports them by team and hiring channel. Common themes in early leavers include a job that differs from what was promised, little support from the manager and too much workload too soon. Each of these can be fixed once it is visible.
Retention in remote and hybrid teams.
Remote and hybrid employees can feel disconnected from their team and invisible to their manager, which raises turnover risk. They can also work longer hours without anyone noticing. Regular capacity and engagement checks give managers a view they would otherwise miss. Combine them with regular one-to-ones on video, clear priorities and deliberate time together, and watch for people who go quiet.
Bringing it together.
Retention software works when it shows where risk is building, explains why and helps managers act early. Engagement and capacity together give the earliest, clearest signal.
Features to look for in retention software.
- 01Engagement and capacity together. See commitment and the energy to sustain it.
- 02Team-level risk views. Which teams need attention first.
- 03Driver analysis. Why a team is at risk, not just that it is.
- 04Action plans for managers. Specific priorities with owners.
- 05Trend tracking. Whether risk is rising or falling after action.
- 06Integration with HR data. Turnover and absence alongside survey results.
- 07Exit and stay insights. Themes from people who leave and people who stay.
What turnover costs.
Replacing an employee costs recruiting time, onboarding, lost output and the extra load on colleagues. Turnover is also high in absolute terms: the US Bureau of Labor Statistics (JOLTS) counted 3.4 million quits in the United States in September 2026, a quits rate of 2.1%. Use the cost of employee turnover to estimate your own numbers and set a value on early warning.
Retention metrics to track.
| Metric | How to use it |
|---|---|
| Voluntary turnover | Overall trend, by team and role |
| Regretted turnover | Focus effort where it matters most |
| First-year turnover | A sign of hiring or onboarding problems |
| Intent to stay | A survey measure that moves before resignations |
| Capacity index | Energy, recovery, focus and resilience by team |
| Engagement index | Commitment and connection by team |
See retention vs turnover for formulas and a worked example.
What thrive at work does differently.
Most engagement tools ask how people feel about their work, manager, leadership and company. thrive at work asks that too, and adds a second question: do people have the energy, recovery, focus and resilience to keep performing? The two answers sit side by side as an Engagement Index and a Capacity Index, each from 0 to 100, and place every team on the thrive matrix: Thriving, Burning out, Coasting or Depleted.
That second index matters because a strong engagement score can hide a team that is close to exhaustion. thrive research shows that employees who are highly engaged but burning out lose three times as many days to not working effectively. An engagement-only tool reports those teams as a success.
thrive at work features.
| Feature | What it means in practice |
|---|---|
| Engagement Index | Purpose, leadership, connection and growth, scored 0 to 100 |
| Capacity Index | Energy, recovery, focus and resilience, scored 0 to 100 |
| thrive matrix | Every team placed as Thriving, Burning out, Coasting or Depleted |
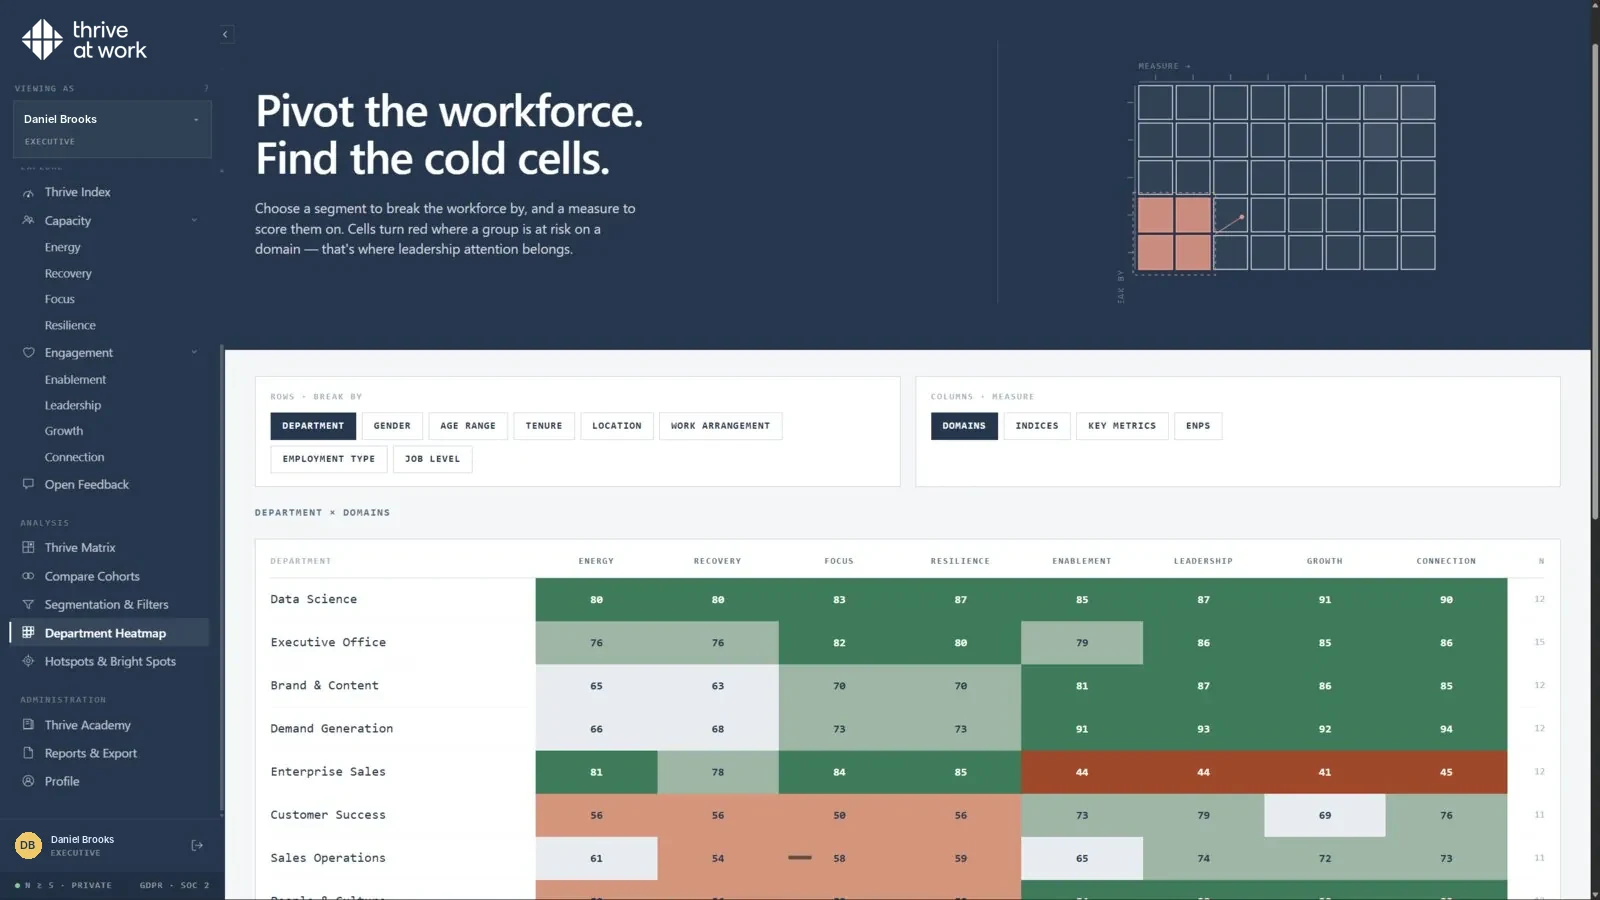
| Team heatmaps and cohort comparisons | See where scores differ by team, location or group |
| Open feedback themes | Comments grouped into themes, with anonymity protected |
| Action plans | Three suggested priorities per team, routed to the manager, the organization or the individual |
| Thrive Academy | More than 300 short courses matched to each person's lowest-scoring area |
| Languages and setup | 13 languages, SSO, HRIS sync or file upload, hosted in the EU |
Retention actions that work.
- 01Fix workload first. Overloaded teams leave regardless of perks.
- 02Strengthen managers. Regular one-to-ones and honest feedback.
- 03Make growth visible. Stretch work and clear paths.
- 04Recognize specifically. Name what someone did and why it mattered.
- 05Hold stay conversations. Ask people what keeps them and what might make them go.
- 06Check pay fairness. Unfair pay cancels other efforts.

The manager's role in retention.
People often leave a manager rather than a company. Retention software helps most when it gives managers clear, early signals and specific things to do: hold a workload conversation, remove one task, recognize a contribution, discuss growth. Make retention part of how managers are supported and assessed, not only an HR metric.
A quarterly retention routine.
| Step | What to do |
|---|---|
| Review | Regretted turnover, intent to stay, engagement and capacity by team |
| Prioritize | Pick the three teams with the highest combined risk |
| Diagnose | Look at drivers and comment themes; talk to the managers |
| Act | One workload change and one growth or recognition change per team |
| Check | Re-measure at the next pulse; keep what worked |
The routine takes a few hours a quarter and keeps retention work focused where it matters most.
A retention conversation for managers.
Ask what keeps the person here, what frustrates them, and what one change would make work better. Act on one thing quickly and follow up.
What leaders should ask.
Which teams have the highest combined risk, what is being done, and is it working? A one-page quarterly review answers all three.
What good retention software changes.
Managers hear about risk while there is still time to act, leaders see which teams need help first, and HR can show which actions reduced regretted turnover. Employees notice that problems they raise lead to change, which is one of the strongest reasons people stay.
First steps.
Start with one quarter: measure engagement and capacity by team, review regretted turnover, pick three teams and act. Then repeat and compare against the baseline.
Why capacity matters for retention.
Exhaustion is one of the most common reasons committed people leave. Engagement scores often stay high until late, because people who care keep going. Capacity scores fall earlier, which gives managers time to reduce load, protect recovery and keep good people before they start looking elsewhere.
Measuring whether retention work works.
Track regretted turnover, intent to stay and capacity by team every quarter. Compare teams with action plans against their own baseline. Keep actions that move the numbers and drop those that do not. See employee retention strategies and how to calculate turnover rate.
thrive at work measures engagement (purpose, leadership, connection, growth) and capacity (energy, recovery, focus, resilience) in one anonymous assessment: see how the assessment works.
Retention numbers only show who has already gone. thrive at work is a workforce performance platform: an employee engagement platform that reads engagement next to capacity to perform, so you can spot the teams at risk months earlier. Read more about employee engagement.
Sources.
- US Bureau of Labor Statistics (JOLTS). www.bls.gov
- thrive index validation study. thrive at work, 2025–26. Methodology.
Common questions
What does employee retention software do?
Can software predict who will quit?
What is the best early warning sign of turnover?
How do you measure employee retention?
Is retention software worth it?

See retention risk months earlier.
A 30-minute call shows what engagement and capacity data reveal about your teams.